Positives Return
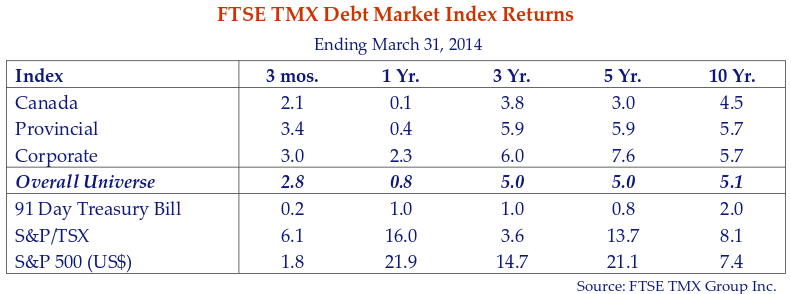
The first quarter of 2014 saw Canadian bond returns climb back into positive territory. This was a relief to Canada’s fixed income investors as 2013 saw the first bond losses since 1999. This is not something they are used to since the DEX Universe has only had losses in 3 out of the last 34 years. It paid to assume credit and duration risk. Canada bonds were safe but sorry with a return of 2.1%. Longer duration provincial bonds were up 3.4% as their longer term benefited from a decline in yields. Corporate bonds had a healthy 3.0% return as spread narrowing added to their higher yield.
The positive quarter allowed bond investors to catch their collective breath. In spite of this brief respite, we believe interest rates in Canada and the US will move higher as central banks end their “emergency programs”. The U.S. Federal Reserve under Janet Yellen, its new Chair, has already started to reduce its controversial “Quantitative Ease” (QE) program of buying of U.S. Treasury bonds and Mortgage Backed Securities. Continued QE “tapering” in the US should be enough to push rates higher with even tepid growth. Bond yields in Canada and other countries will move higher in sympathy with U.S. bond yields. Central banks will continue to anchor short term interest rates with aggressive money market activity but will now have less influence as market forces and inflation expectations dictate longer term bond yields.
Mr. Bonds
Gary “U.S” Bonds belted out his hit Out of Work in 1982. Shortly after the aptly named Mr. Bonds sang his catchy melody the US unemployment rate peaked at 10.8%, the highest since the Great Depression. Mr. Bonds had every right to appeal to the then President Reagan for a job “just driving you around”. A good business manager for Mr. Bonds would have re-released his anthem in 2009 when the unemployment rate spiked again to 10.0%, almost matching the peak of the 1981 recession.
With the U.S. unemployment rate now at 6.7%, things have improved considerably in the last five years. It is hard to understand the current angst over unemployment from a historical perspective. The headline rate suggests the employment picture is the healthiest it has been since 2007. In monetary policy days gone by, Central Banks around the world looked at tightening monetary policy at unemployment rates not far from where the United States finds itself today. As the unemployment rate fell below 6.5% interest rates would inevitably rise. If only it were that simple. As we note (and policy makers know) there are at least two more variables at play – real interest rates and the participation rate.
Particip-Action
The first variable is the level of real interest rates – that is nominal rates less inflation. In 1982, people buying Mr. Bond’s album were making 6.6% above inflation to lend money for 10 years to the U.S. government when they purchased a bond. Today the real interest rate on a 10 Year Treasury is 1.6%. Since nominal yields are also very low, money is cheaper today in both nominal and real terms than at any time in recent history.
The second variable is the participation rate. More and more of the people playing Mr. Bond’s record took his advice and joined the U.S. workforce. The participation rate moved from 64.1% in 1982 to a peak of 67.3% in early 2000. The rate has been falling and is currently 63.2%, lower than when Mr. Bonds penned his persuasive lyrics.
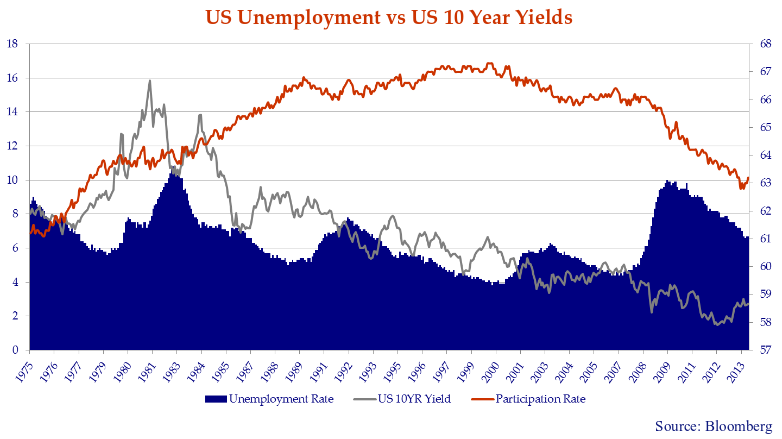
As the chart above shows, instead of rising as unemployment falls, as in previous recoveries, the participation rate is falling with unemployment. What does it all mean? Labour market experts debate whether it reflects the demographic trend of Baby Boomers retiring or “Discouraged Workers” who have given up looking for a job. We are not entirely sure but clearly low interest rates – nominal and real – have not resulted in the employment growth that policy makers so desire.
The Confidence Game
What the chart above fails to capture is confidence – business and consumer. In 1981 Ronald Reagan walked into the Oval Office, negotiated the release of hostages in Iran and plotted a new course. Whether it was his folksy manner, penchant for afternoon naps, or actual policy decisions, the average American bought into his vision. Mr. Reagan restored confidence in a badly bruised America and it was this confidence as much as his economic policies that put America back to work. Unemployment suffered during the Presidency of George Bush Senior but resumed its downward path when Bill Clinton recaptured the imagination of the American public and workforce despite his differing take on what an “afternoon nap” meant.
While President Obama might “outwork” the late Presidents Reagan and Clinton he has failed to fulfill the high expectations of the Americans who first elected him in 2008. That Obama fatigue combines with a polarized and gridlocked Congress to make the average American not quite as optimistic as he used to be. Were it not for the shale gas and domestic energy boom in the U.S., the picture might be decidedly bleaker. While we are optimistic about the growth prospects of the American economy we believe that confidence is more important than low rates for growth. The good news is that the passage of time and a more stable financial system both are decidedly confidence builders.
When Floating Rate Wasn’t Cool.
Sticking with our early 1980s music theme, we ask forgiveness for adapting the words to Barbara Mandrell’s 1981 country music hit I Was Country When Country Wasn’t Cool. Starting in the second half of 2011 Canso began opportunistically purchasing floating rate assets which definitely wasn’t cool at the time. Investors were preparing for financial cataclysm and fixed rate yields had plunged to historical lows in the wake of the Euro debt crisis and the Fed’s QE program.
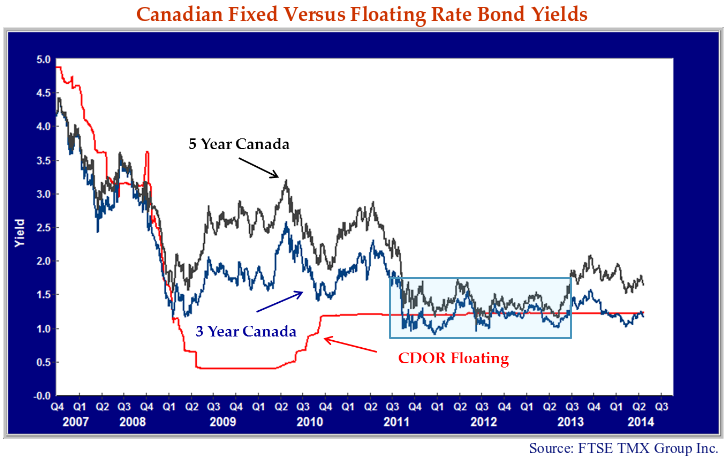
As we have discussed in previous newsletters, we had remarked that one could buy floating rate investments at pretty much the same yield as fixed rate offerings. We compare the CDOR floating rate benchmark to 3 and 5 year Canada bonds in the chart above. The 3 year Canada yield has stayed close to CDOR since November 2011. When the 5 Year Canada bond yield hit its low of 1.04% in July 2012, an investor could increase their yield by selling their bond and buying a floating rate equivalent based on the CDOR rate of 1.25%. This also retracted duration risk by 4 years.
Our substantial investment in floating rate assets was not a top down call on interest rates. Floating rate bonds were much more attractive relative value compared to short-term maturity fixed rate bonds. They offered a higher yield and limited interest rate risk. In our analysis, there were very few scenarios where a short-term bond would outperform its floating rate equivalent. The reduction in duration that resulted from this shift insulated our portfolios as rates rose in the first half of 2013. Despite the modest reduction in government rates in the first quarter, Canso continues to believe the path for long-term rates is higher.
Yield to the Curve
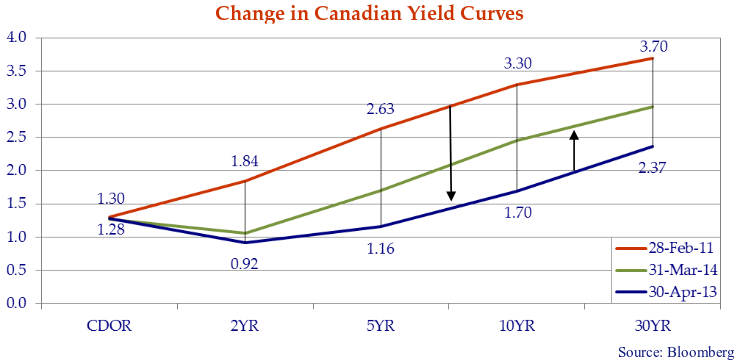
The chart below illustrates the dramatic change in the Canadian government yield curve before and after the US and European debt crisis of 2011. With the Bank of Canada anchoring front end interest rates near 1.25%, 2 year and 5 year government bonds fell 92bps and 147bps respectively between February 2011 and March 2013 with most of that move occurring in the latter part of 2011. In April 2013, 2 and 5 year government of Canada bonds yielded less than the 3 month CDOR – the benchmark for most floating rate notes.
We expect short-term interest rates to be anchored by the Bank of Canada for at least 12 to 18 months. From what we can tell, the Fed and other central banks are messaging a preference for higher levels of inflation, if that’s what it takes to get employment up. It also seems like the concept of “full employment” is a moving target. The Fed recently demonstrated this by dropping the linkage between the U.S. unemployment rate and its policy stance. This suggests to us that the rest of the yield curve will shift upwards as inflation expectations shift upwards towards the official 2% inflation policy targets in most countries.
As the yield curve normalizes and floating credit spreads contract we will be less inclined to purchase additional floating rate notes on a “break even” basis. A look at the charts above shows the current 1.7% yield for 5 year Canada bonds is now well above floating rate CDOR at 1.2%. The advantage of our foray into floating bonds was substantial. A 5 year fixed rate bond purchased a year ago in April 2013 had a Canada benchmark yield to maturity of 1.1%. It now yields 1.7% and still has 4 years until maturity. The rise in the Canada yield of .6% has caused its price to drop by 1.8%. By comparison, although the base CDOR rate has not changed, the floating rate bonds we purchased have had no price depreciation along with their higher yield. These bonds have also had considerable spread compression due to heightened market demand for floating rate assets, which has added to their relative outperformance of fixed rate equivalents.
Investment Hypocrites?
You might recall us warning of the dangers of “Floating Rate” funds and thus we might be open to accusations of hypocrisy. Yes, in previous Corporate Bond Letters we described in detail our concern over the proliferation of floating rate mutual fund products in Canada aimed at retail clients. There are good quality floating rate assets and there are very bad quality floating rate assets. These retail floating rate funds promise yields of 5% to 6% which are unobtainable from investment grade quality floating rate notes. These funds are purchasing floating rate bank loans of very low quality issuers – that is non-investment grade assets – with higher yields but substantial credit and price risk.
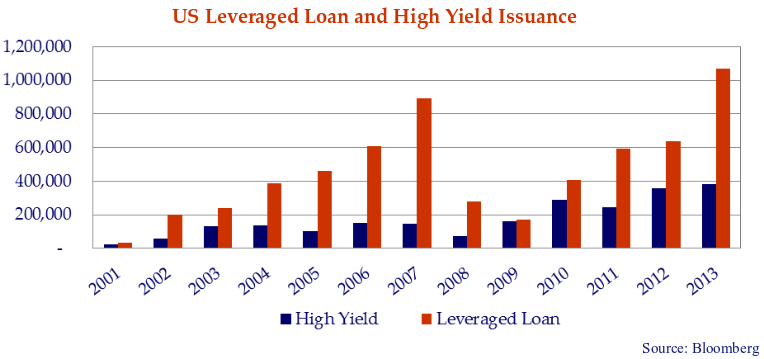
Based on the safety sales pitch, retail investors are pouring money into these products. They seem to think of these very, very low quality loans as money market surrogates and a solid defence against rising interest rates. In their rush to “get invested” and earn their healthy fees, the portfolio managers are falling over themselves to buy loans. Loan arrangers are only too happy to oblige them with increasingly poor structures and weak issuers. The chart below shows that leveraged bank loan and high yield bond issuance has substantially exceeded its pre Credit Crisis levels. Given that many of these loans are financing extraction of dividends for private equity sponsors, we worry about what will happen when there is no one to buy.
When Irish Eyes are (Once Again) Smiling
On St. Patrick’s Day a Canso representative attended a lunch with Ireland’s Minister of Finance Michael Noonan and Irish Ambassador to Canada, Ray Bassett. The Minister’s mood was upbeat. This was not just because Ireland clinched the Six Nations Rugby Tournament the weekend before with a nail biting 22 – 20 victory against France. According to the Minister, the Irish economy has turned the corner on its credit implosion and the country is once again open for business. We summarize a few of the more interesting tidbits highlighted by the Minister during his meal:
- The Irish version of the credit crisis was caused by excessive building activity that fueled the bubble and the collapse of Lehman Brothers that popped the bubble. The collapse of the building sector cratered the Irish economy and the Irish banks. The Irish Government bailed out the banks by guaranteeing their senior debts. This turned out to be ill advised, as the Irish government was then itself bailed out by the International Monetary Fund, European Union and European Central Bank. The bailout terms imposed strict conditions on the Irish Government.
- Building investment peaked at 21% of Irish GDP 2006 and has fallen today to 6%. Government coffers grew fat with revenues driven by real estate related taxes and Irish bank balance sheets bloated with loans to Irish developers. The Minister suggested “normal” building investment should be in the 8-9% of GDP range. Real commercial property prices are down 67% from the pre-crisis peak.
- After years of austerity, Irish GDP growth is expected (by the Irish at least) to be amongst the strongest in the EU at 2.0% in 2014.
- Exports in Pharmaceuticals, IT and Business Services are strong and Tourism has rebounded. Unemployment stands at 12% down from its high of 15% (we wonder what Mr. Bonds would say). Gross debt to GDP stands at 124% and the 7.5% Deficit of GDP at are both trending downwards. Ireland’s “Bad bank” continues the business of realizing value from impaired loans with this process expected to be completed by 2020.
Moody’s upgraded Ireland’s credit rating to Baa3 in January. It then issued €3.5 billion of bonds in the global financial markets in January at 3.54%. Showing how much things have changed, the Irish then borrowed €1 billion of 10 year money in March at a yield of 2.90%.
Credit Tides Can Recede
The Irish experience reinforces an observation we’ve made many times here at Canso; when the credit tide goes out, it is hard not to get sucked into the undertow. The Irish experience of a credit fuelled real estate investment boom that ended badly should be cautionary for Canada. We believe that Canada is firmly in the grip of a residential real estate mania. Canada has record home ownership, employment in construction and residential real estate investment as a percent of GDP.
It is easy in hindsight for experts and pundits alike to pick apart the absurdity of a mania but nearly impossible to spot when in the midst of it. A core part of our investment process at Canso is to test and retest our theories. Understanding consensus and avoiding it has served our investors well through the years. There is nothing more dangerous than the madness of crowds. Éirinn go Brách.
Full, True, Plain (and Transparent) Disclosure
In the past few months the debate in Canada over bond market transparency has moved from obscurity to the front burner. Canso supports full, true and plain disclosure as a tenet of the financial markets. We believe this should apply to the disclosure of Canadian corporate bond transaction data with a modified version of the US TRACE disclosure system in Canada.
As we understand it, the counter argument states that the disclosure of transaction data including pricing reduces market liquidity that in turn hurts market participants. Dealers will be less inclined to take inventory positions and investors will struggle to move or accumulate larger positions. This argument would suggest that markets behave more efficiently without transparency. We find this argument without merit.
The data that we have seen on the effects of the TRACE system on trading in the United States since it was introduced in 2002 refutes this argument. While it is true that investment dealer inventories in the U.S. are lower now than before the Credit Crisis, they rose substantially from the time TRACE was implemented in 2003 until 2007. The reduction in the inventories in the U.S. after 2008 was paralleled by reduced dealer inventories in Canada. This seems to reflect regulatory and internal limitations on proprietary trading rather than increased transparency from TRACE.
When I say WHOA! – I mean WHOA!
With the carnage of the Credit Crisis still visible in the rear view mirror, fixed income investors are involved in a frantic search for yield. We assume with the best intentions, bankers, investors and the regulator in Canada are embracing what we call Non-Viable Contingent Capital (“NVCC”). Stated simply, these securities which pay a coupon under “normal” circumstances convert to common shares if OSFI views an issuer bank as ceased or is about to cease to be viable (i.e. basically at the mercy of OSFI). The idea is to avoid the liquidity freeze that occurred during the Credit Crisis by forcing certain security classes to convert to equity. In non-Canadian markets, Banco Santander, Barclays, Deutsche Bank and Mizuho are just a few of the banks to issue securities with the equity conversion feature clause called “Contingent Capital”.
Here once again we must applaud the efforts of the Canadian Bond Investors Association who are working to inform Canadian investors about the structure and potential pitfalls of NVCC with the mandatory write down clause. In Canso’s view, it is absurd that an instrument disguised as debt can be treated worse in a stress scenario than a bank’s common equity. Why call something debt that can have its value reduced close to zero in a scenario where the issuer bank may still be a viable entity? These types of instruments have the potential to significantly distort the credit markets in our view. Canso shares the view of the CBIA that contractual non-viability securities and regulatory responses associated with these securities have not been tested throughout a full credit cycle, which introduces additional uncertainty as to ultimate credit quality.
I Asked You Not to Tell Me That.
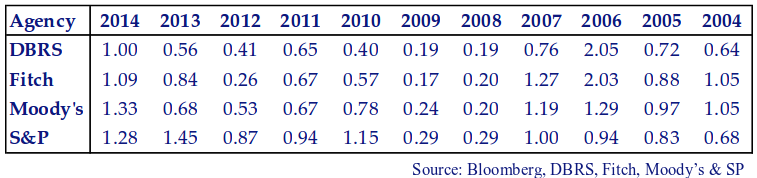
It is with some trepidation that we note the recent rating changes from the major credit rating agencies. Upgrades equaled or exceeded downgrades in Q1 2014 for all four agencies for the first time in recent history. When the credit rating agencies agree that things are getting better, this gives us pause for thought.
Where Do We Go From Here?
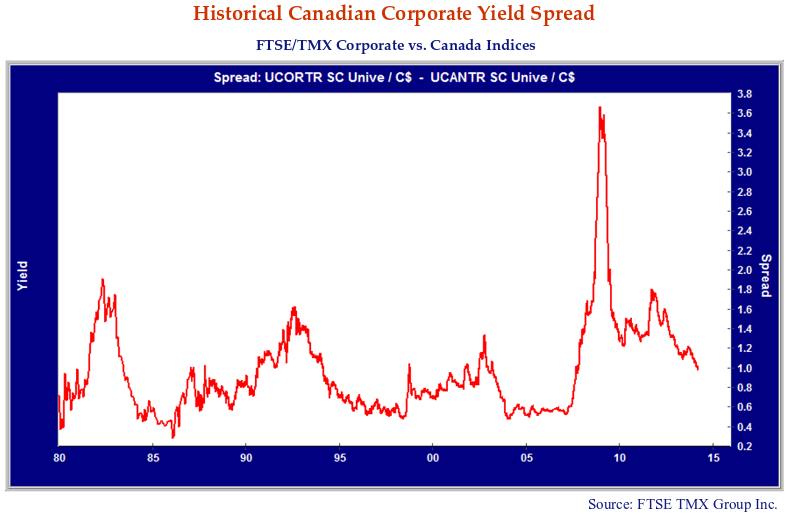
The chart below shows that Canadian corporate bond spreads are just above their 1% historical average and are still “fair value”. They are well above their lows of 0.5% during the very loose monetary policy periods of 1984-88, 1994-98 and 2004-08. We think that with the continued easy monetary policy that we see, corporate bonds are in for a period of tightening spreads. Credit spreads usually increase at the end of the credit cycle, when monetary policy is tightened.
We continue to believe there is reasonable value in the credit markets, although our valuations bias is now towards higher quality. Much of the value that is already embedded in our portfolio holdings will be realized with the passage of time. We will selectively add new positions when relative value dictates we do so.
We remind our clients and ourselves that successful investing generates returns over long periods of time and through the extremes of economic and financial cycles. At Canso we spend much of our time ensuring the consistency and continuity of our investment approach.
We have been through several credit market cycles since starting Canso. It is hard for us to believe that 17 years have passed since we started Canso in May 1997. Our once rather radical idea that bond portfolio managers should do their own credit analysis has become rather mainstream since the Credit Crisis!