Start Me Up
With summer fast approaching, life could not be better for some. Toronto Raptors fans, the graduating class of Morehouse College and aging rocker Mick Jagger, to name just a few. The future is decidedly less bright for British Prime Minister Theresa May, lawyer Michael Avenatti and the Blue Jays, another of Toronto’s professional sports teams.
Summertime Blues
The onset of summer has put everyone in a better mood in years past, no matter the state of the markets. Cold beer and hot barbecue make a tranquilizing and tasty compress for a bruised portfolio. Spring ushered in a decidedly gloomier feel this year with market pros predicting imminent recession if interest rate cuts are not implemented in short order. The change in sentiment in the financial markets over the past twelve months is nothing short of astonishing.
Washington Bullets
U.S. financial markets now predict rate cuts not too much later in 2019, giving credence to Fed officials’ recent comments on economic scenarios that justify lowering interest rates. That stimulative actions are being discussed in the context of a strong U.S. economy is a sign of the unique times in which we live. U.S. GDP expanded a robust 3.1% in the first quarter of 2019 (Canada 1.6%) with unemployment a low 3.6% (Canada 5.4%). With U.S. elections over a year away, the President and his motley economics crew repeatedly berate Fed Chairman Powell over the FOMC’s interest rate policy, pushing for lower rates and an unabashed quest for a second term.
Takin’ Care of Business
The doom and gloomers argue lower rates will stave off an otherwise inevitable recession. A recession resulting from overly restrictive Fed policy as their argument goes. Lower rates likely propelling the stock market higher is just a fortunate byproduct, not the compelling rationale, the gloomers say.
The Long Run
The 1913 Federal Reserve Act created the U.S. central bank. Subsequent legislation in 1933 and 1935 established the Federal Open Market Committee and specified three goals specific to the operation of monetary policy. Through short term interest rate management and adjustments to the availability and cost of credit, the Fed would attempt to achieve maximum employment, stable prices and moderate long term interest rates. It was understood the Fed’s objective of creating long term prosperity for America could run counter to the shorter term political aspirations of those seeking public office. That the term of a Fed Governor is 14 years versus the 4 year term of the President evidences the tension between bureaucrat and politician.
Don’t Bring Me Down
The definition of stable prices evolved over the course of the 20th century to the now widely accepted goal of annualized price increases of 2.0%. Stable prices, the argument goes, allow consumers and businesses to make rational, informed purchase and investment decisions. The conduct of monetary policy involves the Fed utilizing the levers of the overnight rate, open market purchases and, in extreme circumstances, whatever mechanism is deemed suitable, including quantitative easing, to raise interest rates to contain inflation, or to lower interest rates to stimulate inflation.
Three potential drivers of higher inflation exist in the U.S. today:
Higher U.S. inflation would in turn be negative for fixed income investments, most notably long duration fixed income. The knock-on effects of higher U.S. inflation would be felt in Canada and financial markets around the world.
Two Out of Three Ain’t Bad
Taken in isolation, any one of the policy positions above is inflationary. The combined effect of inflationary trade and fiscal policies is manageable with appropriately restrictive Fed policies. Taken all together these three policies create a potentially lethal cocktail for longer duration fixed income.
Should the Fed opt for interest rate cuts, it is only a matter of time before inflation moves substantially higher than its current 2.0% reading. While the Fed controls administered rates, the financial markets determine rates out the yield curve. Unchecked inflation could result in dramatically higher longer term yields. Would you buy a 30 year US treasury yielding 2.6% if inflation is 3.0% or higher?
Won’t Get Fooled Again
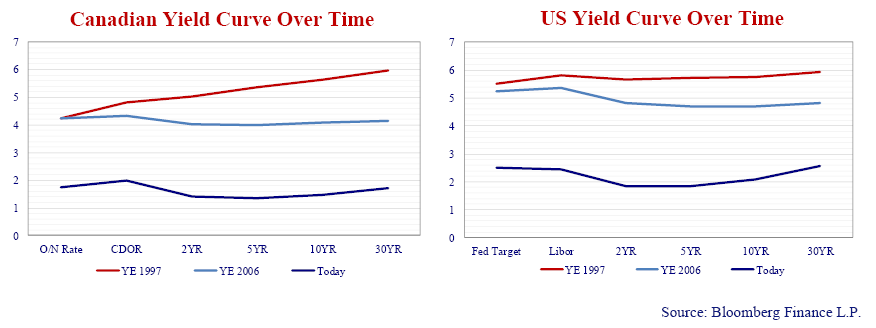
Economists and pundits cite yield curve inversion as a clear indicator of coming recession. Yield curve inversion is a thing. In Canada, 5 year Government of Canada yields are lower than CDOR, the CAD floating rate benchmark, and in the U.S. 10 year yields are lower than Libor, the USD floating rate benchmark.
The graphs above depict the Canadian and U.S. yield curves at year-end 1997, just prior to the Russian Debt Crisis, at year-end 2006, just prior to the Credit Crisis, and today. Importantly, despite the inversion in shorter maturities, the yield curve is positively sloped in Canada from 5 years to 30 years and in the U.S. between 2 and 30 years. Note the curves are steepest between 10 and 30 year bonds, 25bps in Canada and 48bps in the U.S.
It is no more evident today than it was in 1997 or 2006 that a recession is inevitable or a meltdown is around the corner. It is clear that if a recession is around the corner the Bank of Canada and the Federal Reserve have less latitude to cut rates to stimulate growth. Based on the positive slope of Canadian and U.S. yield curves it is also clear the markets are concerned about the future path of inflation.
It Tastes Awful and It Works
Canso’s portfolios include investment grade quality floating rate notes. Tell someone you “buy cheap stuff”, “fallen angels”, or “special situations” and they nod approvingly. Tell someone you buy high quality floating rate notes and their face scrunches up like after a spoonful of Buckley’s cough syrup. High quality floaters are quite possibly the least understood but most important “value investment” in our Canso portfolios.
Admittedly the all-in yields on the highest quality floaters we own are modest. That said, these floaters are the best defense against the risk of capital loss associated with rising inflation and its impact on longer duration assets. Floaters provide current income, capital preservation and a saleable asset should the yield curve steepen or credit premiums widen, providing opportunity elsewhere in the credit markets.
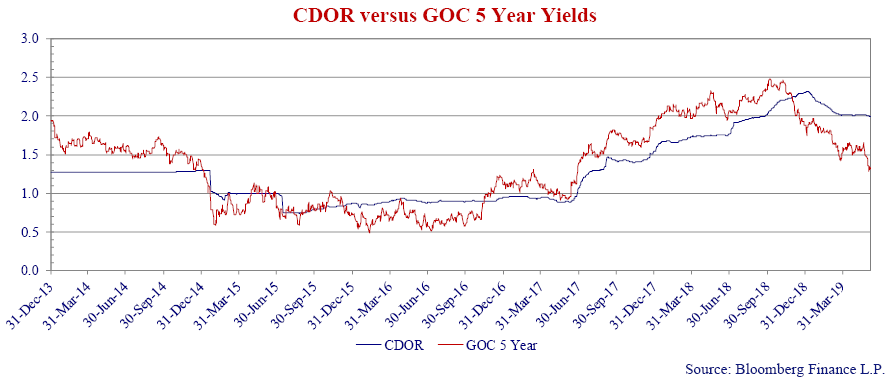
At Canso we are deep value, fundamental analysts, employing a bottom up, relative value approach. Our relative value comparisons determine whether an investment qualifies for inclusion in the portfolio. And value we see in floaters. The graph above plots floating rate CDOR versus fixed coupon Government of Canada 5 year yields, two of the benchmarks in the Canadian credit markets. The parity and at times positive spread between CDOR and 5 year Canada bonds in recent years makes floating rate securities more attractive than fixed rate securities for similar credits.
Note that the floating rate securities Canso owns are not leveraged loans. Leveraged loans carry non-investment grade ratings and are discussed later in this Newsletter. In a low yield, tight risk premium environment, high quality floaters prove a compelling alternative to low yielding, higher risk, longer duration assets and much higher risk leveraged loans.
Six Months in a Leaky Boat
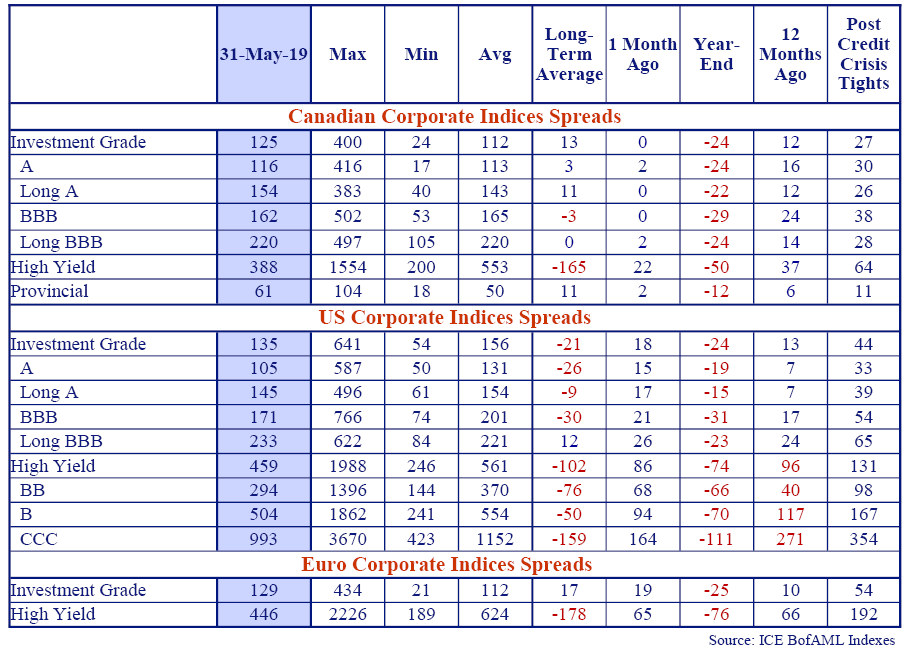
Yields are substantially lower in Canada and the U.S. over the last three quarters. It has been volatile in the credit markets over the same period. Risk premiums are tighter than at year-end, wider than a year ago and wider still versus post Credit Crisis tights. Those simple statements bely the roller coaster nature of credit spreads since Q4 2018. As an example, high yield spreads have gapped up or down an average of 60bps per month dating to October 2018. Credit markets have never been for the faint of heart and whipsawing risk premiums continue to test the conviction of investors. What’s an investor to do? Hang on, double down or abandon ship?
At Canso we take informed risks when we are compensated to do so. At any given point in the cycle the credit markets serve up opportunities. Our job is to take high conviction positions when they are available and to avoid expensive fads favoured by the broader markets.
Look Out Below
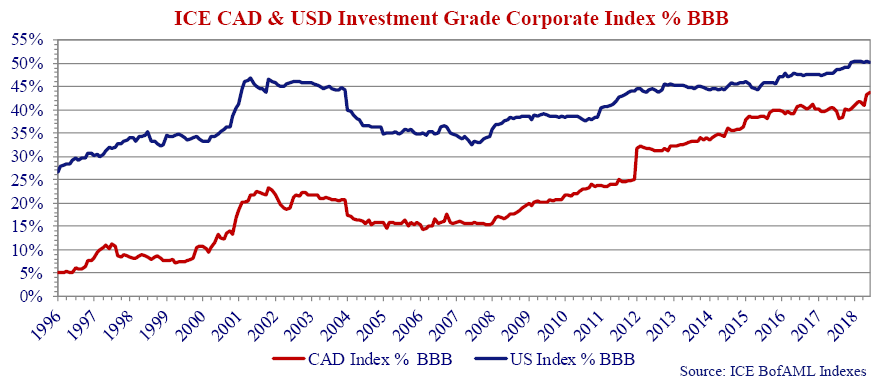
Much attention has been paid and many words written about the increased leverage and corresponding erosion of credit quality of corporate America. We show you evidence of the growth in the BBB segment of the credit market in the chart below.
The graph shows the BBB percentage of the Canadian and U.S. investment grade markets based on face value. In Canada, BBB’s comprise a record 42.8% of the CAD investment grade corporate bond market. The BBB percentage of the U.S. investment grade corporate market increased to 50.1% at year-end 2018 marking the first time BBB’s comprised the majority of the investment grade universe.
Come On In, The Water’s Fine
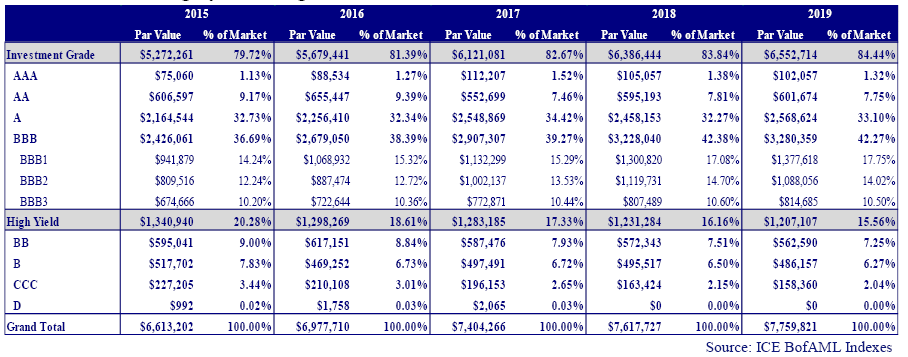
The table below combines the ICE BofAML U.S. Investment Grade and High Yield indices. It verifies the BBB segment is the largest portion of the U.S. credit market. It also shows within the BBB segment, the BBB+ category is the largest and BBB-, the smallest.
Generalizations about the growth of the BBB market and the threat that downgrades pose to lower rated segments ignore sub categories within the BBB segment. The generalizations presume corporates rated BBB+ are as likely to be downgraded to non-investment grade as those rated BBB- which is not the case.
Importantly, while the BBB segment now comprises 42.3% of the overall U.S. credit market versus 36.7% in 2015, the BBB- category measures 10.5%, virtually unchanged versus 2015. The U.S. BBB rated category is 5.8 times larger than the BB segment of the high yield market. More relevant in our view, the BBB- category is only 1.4 times larger than the BB category. In our opinion the BBB overhang is not as ominous a threat to the high yield market as the headlines would suggest.
Hang On, Help Is On Its Way
Actual experience shows downgrades of BBB rated corporates to high yield, so called crossover downgrades, may or may not be disruptive. The impact likely depends on a variety of factors including the point in the credit cycle downgrades occur, the nature of the individual credits downgraded and supply and demand imbalances within the high yield market at the point of downgrade.
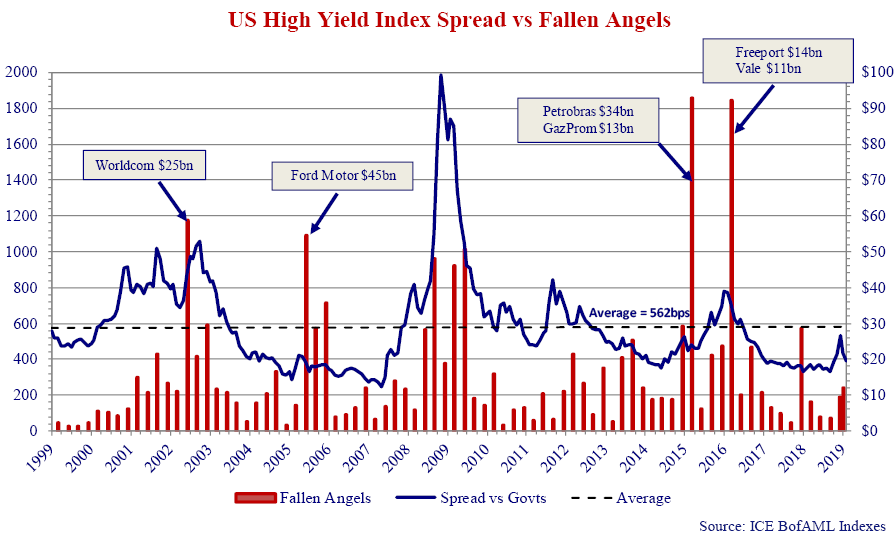
The chart below shows the U.S. High Yield Index Spread versus volumes of Fallen Angel downgrades or investment grade companies downgraded to non-investment grade. Since 1999, Fallen Angels are created at an average $15.7 billion every quarter. Large crossover downgrades in the past have not always coincided with widening credit spreads.
In May 2002, Worldcom Inc.’s $25 billion of debt was downgraded to BB. Ford Motor Company’s June 2005 downgrade impacted $45 billion of Ford debt. At the time of downgrade, Worldcom and Ford bonds represented 6.7% and 7.5% of the total high yield market and 17.6% and 19.4% of the BB portion of the high yield market. In both cases, the credit spreads rallied shortly thereafter. In Q1 2015 and Q1 2016, $92 billion of securities were downgraded to non investment grade. In 2015 spreads widened subsequently, in 2016 spreads tightened subsequently.
Interesting that since March 2016 the par value of the high yield bond market shrank by $173 billion. The contraction in the non-investment grade bond market was more than offset by the expansion of the US Leveraged Loan market. We would argue there is additional capacity in the high yield market to absorb any substantial downgrade of BBB bonds.
You Think yUSe Got Problems
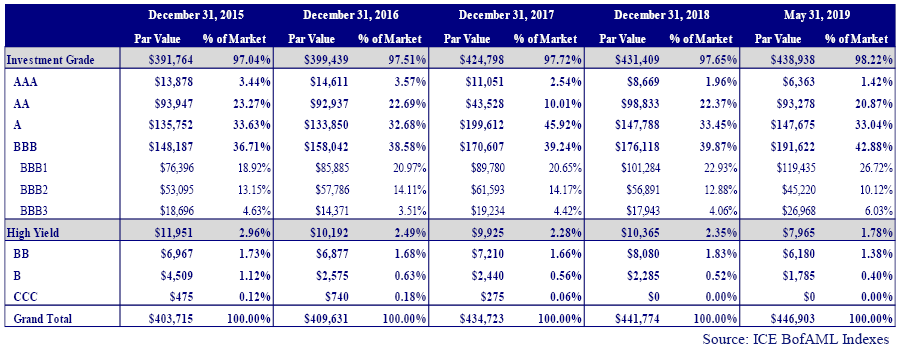
In Canada the BBB portion of the ICE Canadian Corporate Bond Index has grown from only 5.1% of the market in 1996 to 42.8% today.
What separates Canada from the U.S. bond market is the absence of a well developed high yield market. The Canadian BBB segment is 24 times the size of the entire Canadian high yield market and the BBB- category is 4.5 times the size of the BB portion of the CAD high yield Index. In Canada the downgrade of a large BBB credit could have a significant impact on the CAD high yield market.
“I See Nothing, I Know Nothing”
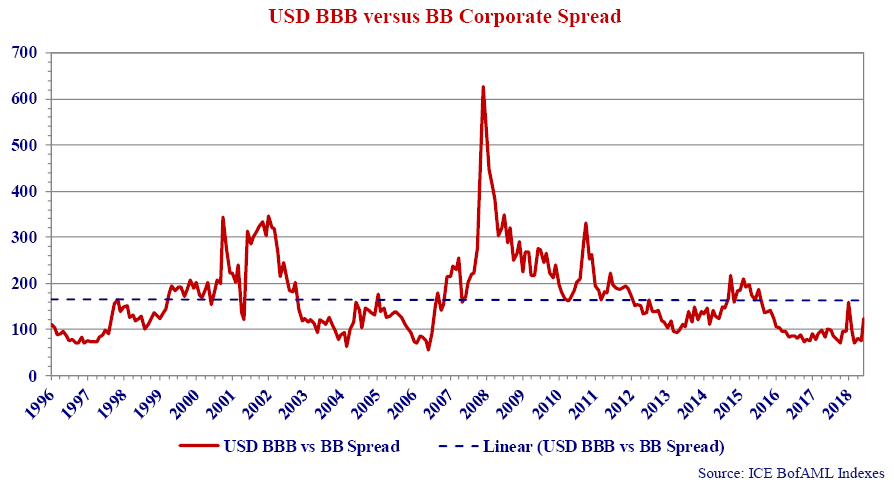
If a calamity is in the making, the U.S. high yield market seems blissfully unaware. In the words of the incomparable Sergeant Schultz of Hogan’s Heroes fame: “I see nutting, I know nutting.” The spread between U.S. BBB rated corporates and BB rated corporates measured 123bps at May 31, 2019, well through the 166bps long term average.
So either BBB’s are cheap or BB’s are expensive. BBB bonds are 21bps through long term average while BB’s are 76bps through long term averages. We would suggest BB’s are expensive along with the rest of the U.S. high yield market.
“Ah, excuse me… just one more thing”
In 2019 the Financial Stability Board, Chaired by Randall Quarles, who also happens to be Vice- Chair of the Federal Reserve, launched an investigation into the leveraged loan market and specifically the role of collateralized loan obligations in that market. The ECB, the Federal Reserve and U.S. Congress are also asking questions of leveraged loan market participants.
We’ve frequently highlighted the risks in the leveraged loan market in this publication before. Canso’s concerns with the leveraged loan market center on:
- Systematic erosion of covenant protections, specifically:
- Elimination of maintenance covenants (term “covenant lite”).
- Higher allowed senior and overall leverage.
- Exaggeration of pro-forma EBITDA adjustments.
- More lenient restricted payments provisions.
- Flexible security carve outs.
- Compressed risk premiums the result of indiscriminate buying by CLO’s (leverage on leverage) and passive investment vehicles (retail investors).
- Expected lower recovery rates than in previous downturns as a result of covenant erosion described above.
- Rapid growth of the market driven by CLO and structured vehicle proliferation.
- Liquidity mismatch between funds offering investors t+2 liquidity versus loan assets which trade t+7. The markets plumbing is archaic and not suited to rapidly moving markets and cash on demand vehicles.
- Agent banks retain little to no exposure on originated loans reducing incentives to negotiate stricter covenants or better pricing.
The last several years have probably been the best time in history to be a corporate borrower. Borrowers benefitted from lower credit spreads with few restrictions imposed by undiscriminating lenders in a rush to “get invested”. The market is best described as Credit Lite loves Covenant Lite. This will not end well. We believe that credit investors are about to get the “Living Credit Day-Lites” knocked out of their portfolios.
We’re Not Gonna Take It
We do not believe lenders are compensated for the risks they are assuming in the leveraged loan market. Retail investors are being sold a good story – floating rate assets with no interest rate risk (no duration risk), first lien priority (first lender in line if something goes wrong so high recoveries) and 4 – 6% returns (possibly higher) in a low interest rate environment.
On the surface it sounds terrific, manna from heaven, but upon further investigation our take is the story is too good to be true. Eventually the issues highlighted above will come home to roost and investors will pay the price. There will be an incredible opportunity to participate in the leveraged loan market – it is just not now.
That Happened to You Too?
The search for yield has led investors to leveraged loans and often the private placement (PP) markets. Investors seem willing to accept reduced liquidity for increased yield, the “illiquidity premium”. They buy securities that do not benefit from some or all of the following characteristics:
- Public company disclosure requirements;
- Credit ratings;
- Index inclusion;
- Distribution to a large number of buyers.
This makes these investments harder to trade but investors in them seek higher spreads than available in public market and ultimately above public market returns.
In Canso’s extensive experience, PP premiums versus comparable public issues range from 0 to .5% (50 bps) depending on market conditions. At times PP’s offer exceptional value to those with the expertise to evaluate and appropriately price risk, at other times they do not. Recently we’ve witnessed more aggressive “financial modeling” in traditional investment grade rated deals, to justify tighter spreads.
How does this happen? In the case of larger PPs, the issuers often work with a small group of insurance companies. Insurance companies allocate a private placement budget at the beginning of each year and those funds are spent during the year. Depending on the size of the insurance company, PP budgets and the availability of product, the supply demand imbalance can erode or erase the differential between public market and PP spreads.
We have seen increasing “investment wishful thinking” over the last several years and as a consequence we have been less active in acquiring new issue PP assets. To a certain extent the PP departments of the insurance companies are indiscriminate buyers as they seek to spend their allocated budgets. This is not dissimilar to the phenomenon of CLO buyers in the leveraged loan markets. The result is better pricing and terms for the borrowers and less premium for the buyers.
“You’re not from around here, are you?”
On March 5, Larry Culp, CEO of General Electric, stated the company’s industrial unit would generate negative free cash flow in 2019. This comment generated notes of concern from Wall Street analysts and negative headlines from the newsmedia. Bloomberg News flashed “GE Plunges Again, Imperiling New CEO’s Rally.”
“Plunge” and “imperil” make attention grabbing copy but bear little resemblance to the reality of goings on at GE as we understand them. That each announcement and comment made by management of one of the most widely followed and closely analyzed companies in the world is treated as if it is an unpredictable revelation amazes us.
In his short tenure, Larry Culp has consistently highlighted GE’s exposures and risks while articulating a clear strategy to address those shortcomings for the benefit of GE’s stakeholders. It would seem America, and more specifically Wall Street, doesn’t have time for a straight shooter anymore.
Making It Work
At Canso we did not fret when the “plunge” and “imperil” headlines crossed the Bloomberg pages. We did not “high five” on January 31st when GE announced the sale of a portion of its health care business for $21 billion, equivalent to nearly 1/3 of GE’s industrial debt and unfunded pension liability. Re-structuring a business the size and scale of GE will take considerable time and energy. Properly assessing the investment merits of businesses such as GE requires an equivalent expenditure of time and energy. Informed investing is borne from rigorous analysis, not emotional reactions.
GE will not turn itself into a stock market darling overnight. Eventual repayment of principal and interest requires GE be viable, not perfect. GE’s core Aviation Finance, Health Care and Renewables businesses are solid performers. Asset sales and spin-offs, dividend cuts, liability reduction and extinguishment, and meticulous attention to reviving the lagging Power business are all announced or well underway. The company’s cash on hand and available credit near $50 billion.
Mr. Culp plans to transform GE into a leaner, meaner enterprise with credit metrics consistent with a “A” credit rating. This will not occur in a straight line and there will be negative announcements to go along with the positive ones along the way to credit redemption. The violent fluctuations in the equity and credit market valuations of GE securities over the last 8 months once again proves Canso’s raison d’etre the “inefficiency” of the financial markets.
I Am the Master of My Fate
Canso’s approach maintains flexibility to invest across the credit spectrum, including unrated, when appropriately compensated for risks assumed. An investor can also benefit from investing in securities in different forms including bond and loan, fixed and floating, short and long term, Maples and Euros, bullet and amortizing structures.
This flexibility allows investors to exploit inefficiencies in the credit markets when these inefficiencies exist and to avoid or reduce exposures to expensive securities when markets get ahead of them-selves. The worst case scenario is to be mandated to buy something which is acknowledged to be expensive – for example, high yield heading into the Credit Crisis.
Gimme Shelter
Graphs and charts provide insight into the markets. What they don’t tell you is which individual securities to buy. Our relative value security selection approach continues to bias our security selection towards higher quality securities and floating rate issues. We also continue to find value in our special situations, which is why we still own select below investment grade bonds. And long BBB’s might look rich but historical spreads show further credit spread compression is likely. We still think there is little redeeming value in leveraged loans. We await the wave of desperation selling that will inevitably occur when panicked investors pull their money from the Indexed bank loan ETFs and mutual funds.
At Canso if we are compensated for risk, we will take the risk. Since risks are high and compensation for the heightened risk low, we are content to move up in quality. The additional yield available from weaker credit pales compared to their downside.
We are content to be safer now and not sorrier later.
