Toronto’s Centric Moments
Despite being roundly disliked by the rest of Canada, Toronto had its moments last year. The Argos and TFC won their respective league championships, the head of the Toronto Transit Commission was appointed to fix the New York subway system and Prince Harry proposed to Toronto’s adopted Meghan Markle.
Toronto was also popular with the digitally cool crowd. It made the short list for the location of Amazon’s second headquarters and Google chose Toronto to implement its vision of the urban future:
“We looked all over the world for the perfect place to bring this vision to life and we found it here in Toronto,” Dan Doctoroff, chief executive of New York-based Sidewalk Labs, told a crowd Tuesday at Corus Quay that included Prime Minister Justin Trudeau and Eric Schmidt, executive chairman of Google’s parent company Alphabet …
… Doctoroff said his two-year-old company looked across North America, western Europe and Australia for the best place to try new ideas including self-driving buses and mass-production modular homes to solve major problems of urban living such as high housing costs, commute times, social inequality, climate change and even cold weather keeping people indoors.” (Toronto Star, David Rider, Oct. 17, 2017)
We failed to confirm the rumour that Google would also be using its vaunted artificial intelligence capability to lead the Toronto Maple Leafs to a Stanley Cup but we remain ever hopeful.
A Candle in the Wind
Sadly, Maple Leafs legend Johnny Bower passed away. Mr. Bower backstopped the Leafs to their last Stanley Cup win in 1967. That he was 93, speaks as much to his longevity (he played until he was 44) as it does to the Leafs’ futility. Elsewhere in the entertainment world, Neil Diamond retired and sometime Toronto resident Sir Elton John, gave notice that there is only three more years to catch his Captain Fantastic act before the wind blows his performance candle out. Apparently some kid named Bruno Mars has potential.
Not Souper
Toronto and surrounds took it on the chin as General Electric confirmed the closure of its Peterborough manufacturing facility. Campbell Soup followed with the announcement it is shutting its Etobicoke plant. These closures came despite a low Canadian dollar averaging 77 cents over the last 3 years. We see this as hard proof that the foreign exchange rate is not the only driver of boardroom decision making and a home country bias that is exacerbated by Trumponomics. Prolonged NAFTA negotiations and stricter mortgage qualification rules don’t auger well for Canada’s economic growth potential.
The Long and Short of It
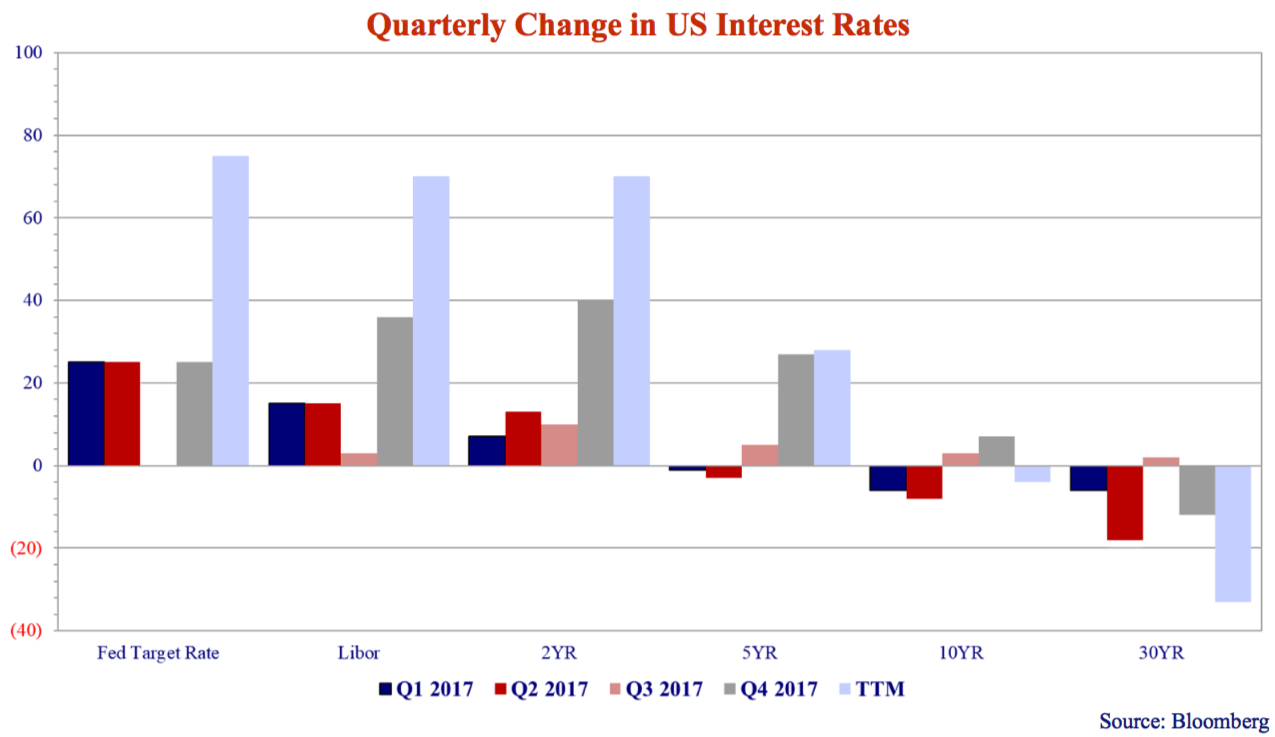
The markets ignored the US political shenanigans in 2017 and focused instead on strong economic data and accommodative tax policy. The Federal Reserve raised its administered rate three times by .25% in 2017 for a total increase of .75%. The Bank of Canada was just behind, raising rates twice by .25% for a total increase of .5%. The US and Canadian yield curves, the difference between 2-Year and 30-Year Bonds, flattened around 1%. US and CAD investment grade credit spreads, the difference in yield between corporates and Canadas, tightened by .3% and US high yield bonds tightened by 1%.
Longing for Duration
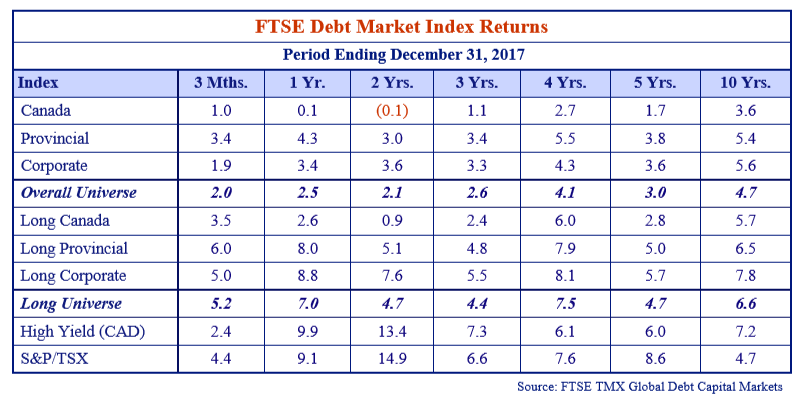
As yields rose, Canada bonds returned a modest 1.0% and 0.1% for the 3 and 12 months ended December 31, 2017. Flattening yield curves and tightening credit spreads meant it was best to own long duration credit last year. Provincial government bonds returned 4.3% and the FTSE Corporate Index returned 3.4% for 2017.
Long credit spread narrowing gave Long Corporates the edge at 8.8% for 2017 versus 8.0% for Long Provincials.
The 8.7% difference in return between the FTSE Canada Index return of 0.1% and the Long Corporate return of 8.8% is proof positive that not all fixed income is created equal.
We are often asked “why own fixed income at all?” We note over the last 10 years the FTSE Corporate Index returned 5.6% beating the Canada and Provincials bond indices. Corporate bonds also generated an astounding 100 bps more than the 4.7% return of the S&P/TSX. If just owning the Corporate Index can outperform equities, think what an actively managed corporate bond portfolio can do!
Where Does the Time Go?
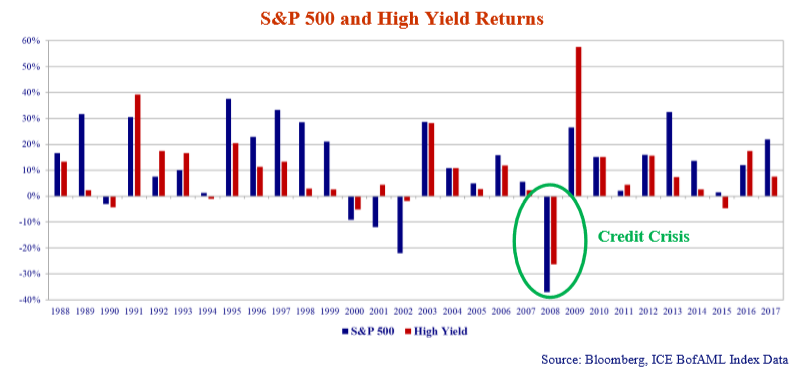
The end of 2017 reminded us remarkably over 10 years have passed since the beginning of the Credit Crisis in 2007. Cracks in the sub-prime mortgage market prompted a series of Fed rate cuts, interventions, and rescues. The crisis peaked in 2008 with JP Morgan’s reluctant takeover of Bear Stearns in March and the market jarring Lehman Brothers bankruptcy in September.
The chart below shows the impact on both the debt and equity markets. The S&P 500 fell 37% in 2008 while the US high yield market erased 26% of its value.
Heartaches by the Number
The Credit Crisis ushered in a period of ultra low administered interest rates in the United States and around the globe. When near zero interest rates were deemed insufficient, the Federal Reserve initiated a series of “emergency measures” which came to be known as Quantitative Easing.
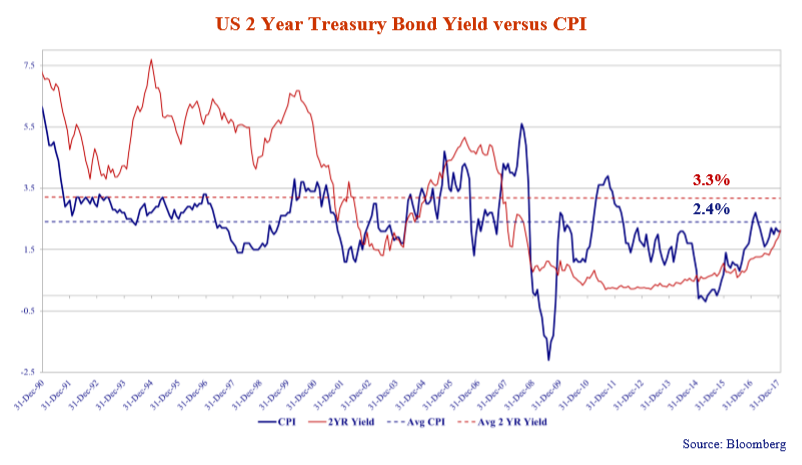
The Federal Reserve and other Central Banks have only recently started to reverse emergency measures taken to combat the Credit Crisis. Administered rates are rising in the US, Canada and the UK but still have a long way to go to get anywhere close to normal. Our historical research suggests that the normal level of interest rates is inflation plus 1 to 2 percent.
The chart below shows the US 2-Year T-Bond yield (solid red line) versus the US Consumer Price Index (solid blue line). Note that the 2-Year T-Bond yield was higher than inflation until the Credit Crisis, but has largely been less than inflation since 2008. This is due to the extraordinary measures taken by the Fed.
The current US inflation reading year over year is 2.1% which implies a normal level for the US 2-Year yield of 3.1 to 4.1% or 1.0% to 2.0% higher than current levels. This shows that we’ve got a long way to go just to get back to normal interest rates, let alone restrictive monetary policy.
Thrice Ain’t Nice
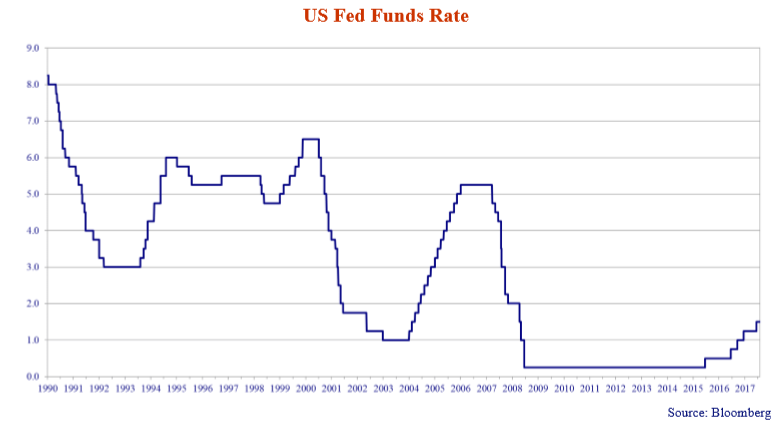
Three is the number of times and 25 bps (.25% or 25 basis points) is the amount that the Federal Reserve is expected to increase interest rates in 2018. This on the heels of the three 25 bps increases in 2017 and the two 25 bps increases in 2015. The current Fed target rate is 1.5% and we will end 2018 at 2.25% should the Fed stay true to its present course. Administered rates in Canada have already moved 25 bps higher in 2018. While the Bank of Canada (BOC) is unlikely to move in lock step with the Fed, we expect it will likely move at least once more this year.
It is instructive to look at other periods where the Fed has tightened monetary policy. We have plotted the US Fed Funds rate since 1990 on the graph below. As you can see, it has increased since 2016, however you can also see how long and low it stayed at near zero in the aftermath of the Credit Crisis from 2007 to 2008.
Crash Diving Interest Rates
The Fed has an obvious “gradualist” tendency to raise rates in smaller increments for long periods, as was the case from 2004 until 2007. The hope is that the financial markets incorporate higher rates into their forecasts, but this never happens. Once rates are high enough to bite into economic activity, the financial markets inevitably crash with the most speculative assets falling the most in price. The graph shows the glaring historical pattern of the Fed to raising rates and then crash diving them lower in response to financial crises. This happened after the dot.com bust in 2000 and the Credit Crisis in 2007.
We have prepared the table below which revisits three previous prolonged Fed tightening cycles. The trough to peak rate increase was 1.75% on the low end (6 tightenings) and 4.25% on the high end (17 tightenings). The current tightening cycle is striking for the 7 year duration of the trough and the gradualness of the rate increases of only 1.25% over the last 2.1 years. The Fed songbook seems to say to us, to quote the singing duo the Carpenters, “We’ve Only Just Begun”.
Three “OH!!” Three
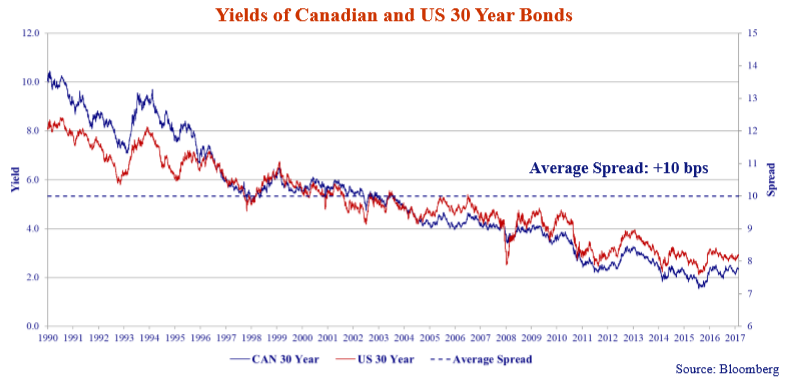
The current yield on the 30 year US Treasury is 3.03% versus a 20 year average yield of 4.3%. A 30 year Government of Canada bond yields 2.42% versus a 20 year average of 4.05%. It is an understatement to say that both those rates are really low!
The Government of Cannabis
We are still perplexed by the absolute low levels of yields. We also remain particularly perplexed as to why the Government of Canada now borrows 30 year money at a remarkable 61 bps less than the US Treasury. The chart above shows since 1990 Government of Canada 30 year bond yields have averaged 10 bps above 30 year US Treasuries.
Perhaps this could be justified during the depths of the Credit Crisis as Canada’s economy did prove more resilient. There is also a “Pot Boom” in the Canadian stock market as the Canadian government moves to legalize marijuana so that might be why Canadian bonds are so “high” and their yields so low! Whatever it is, with the US economy now fairing very well and NAFTA and residential real estate challenges facing the Canadian economy, we think this relationship should revert to normal.
Flatliners
The chart above shows the US yield curve from 2-Years to 30-Years flattened 103 bps (1.03%) in 2017. Long 30-Year US treasuries ended the year yielding 2.74%. This was remarkable, considering the Federal Reserve was raising administered rates in its response to an expanding economy. US 30-Year yields seem to be predicting a recession. We think this too shall reverse.
Unbalanced Sheet!
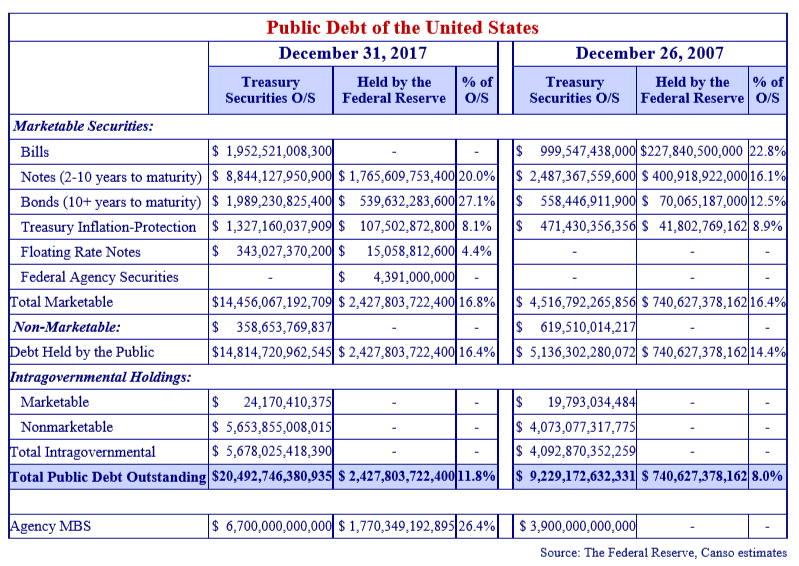
The table below shows the Public Debt of the United States and the Fed’s holdings of that Public Debt at the end of 2017 and 2007. Over the last 10 years total United States Public Debt outstanding has ballooned to $20.5 trillion from $9.2 trillion. While US Public borrowing has exploded, the Fed’s proportional ownership of the overall US Government’s marketable debt is essentially unchanged at 16.8% at year-end 2017 versus 16.4% at year-end 2007. What has changed dramatically is the composition of the Fed’s ownership.
Today the Fed owns no Treasury bills versus $228 billion or 22.8% of the bill market 10 years ago. The Fed owns 20.0% of the US treasury note market (maturities between 2 and 10 years), up from 16.1%, and most importantly 27.1% of the US treasury bond market (maturities in excess of 10 years), versus 12.5%. Further, the Fed purchased agency MBS in the amount of $1.8 trillion or an estimated 26.4% of this market. As the Fed extended its ownership of securities out the yield curve, it took a significant amount of duration out of the marketplace. It is difficult to overstate the impact these purchases and maturity extension by the Fed had and continues to have on US treasury demand and ultimately US treasury yields.
When the Walls Come Tumblin’ Down
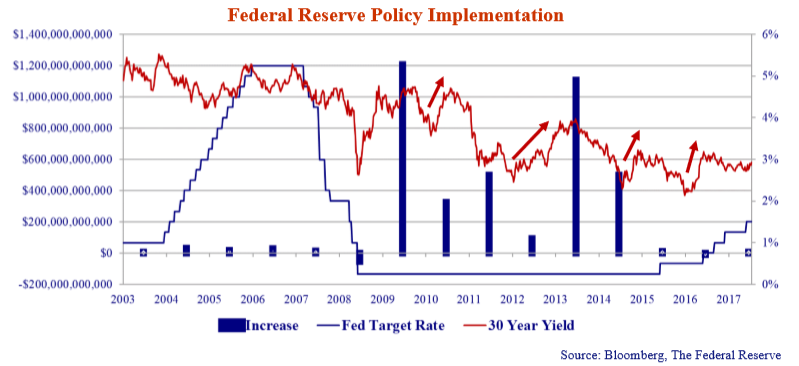
Beginning in late 2009 and ending in late 2014, the Federal Reserve enacted a series of open market purchases of securities designed to lower interest rates. Officially, these programs were known as Large Scale Asset Purchases (LSAP) but quickly became known more commonly as Quantitative Easing acts 1, 2 and 3. These programs were augmented by the Maturity Extension Program (MEP) whereby the Fed sold shorter maturity US treasury notes to buy longer maturity US treasuries. The magnitude of LSAP and MEP programs can be seen in the chart below.
The blue bars in the chart above shows the cumulative net purchases of MBS, TIPS, Notes and Bonds by the Federal Reserve (left axis) by year. The red line is the yield on the 30 year US Treasury bond and the blue line the Fed Target rate.
It strikes us that despite the enormous interventions of the Fed, there were several periods following QE1 when long yields rose prompting the Fed to implement additional asset purchases (QE2, Q23 and MEP). The Fed is now in the midst of a balance sheet normalization program decreasing its reinvestment of principal payments it receives from securities owned over the coming months. As the Fed moves from being the dominant buyer to exiting the market we expect long yields to move higher.
According to the Federal Reserve’s own research, they agree: “the 10-year Treasury TPE (Term Premium Effect) at the end of 2016 was estimated to be negative 100 bps. Roughly speaking, this implies the yield on a 10-year Treasury security would be 100 bps higher absent the Federal Reserve’s LSAPs and MEP programs.” (The Federal Reserve, April 20, 2017)
Don’t You Forget About Me
In addition to the Fed’s exit from active purchases of treasuries and agency MBS, other dynamics in the market portend higher rates. Some estimates suggest the US deficit could exceed US $1 trillion this year (the official estimate is US $400 billion) implying substantially increased borrowing requirements. Also, in response to the recent change in the tax regime in the US, companies with large holdings overseas will begin repatriating these to fund employee bonuses, share repurchases and dividends, among other things.
As an example, of Apple’s $268 billion in cash, cash equivalents and marketable securities at September 30, 2017, $55 billion consisted of US Treasuries, $153 billion of corporate bonds and $22 billion in mortgage and asset backed securities. Sales of corporate investment portfolios will take place into a market grappling with increased US government borrowing and the absence of its largest buyer for the last several years
Finally, the market appears to be trading under the assumption that there are no credit issues for and with the US government. Increased deficits, political stalemate and protectionism all could lead investors or rating agencies to re-evaluate the credit standing of the United States. As a reminder in August 2011, S&P downgraded the US credit rating to AA+ from AAA. It is possible the agencies review the sovereign credit which could put additional pressure on US government bond yields.
Looking Out My Back Door
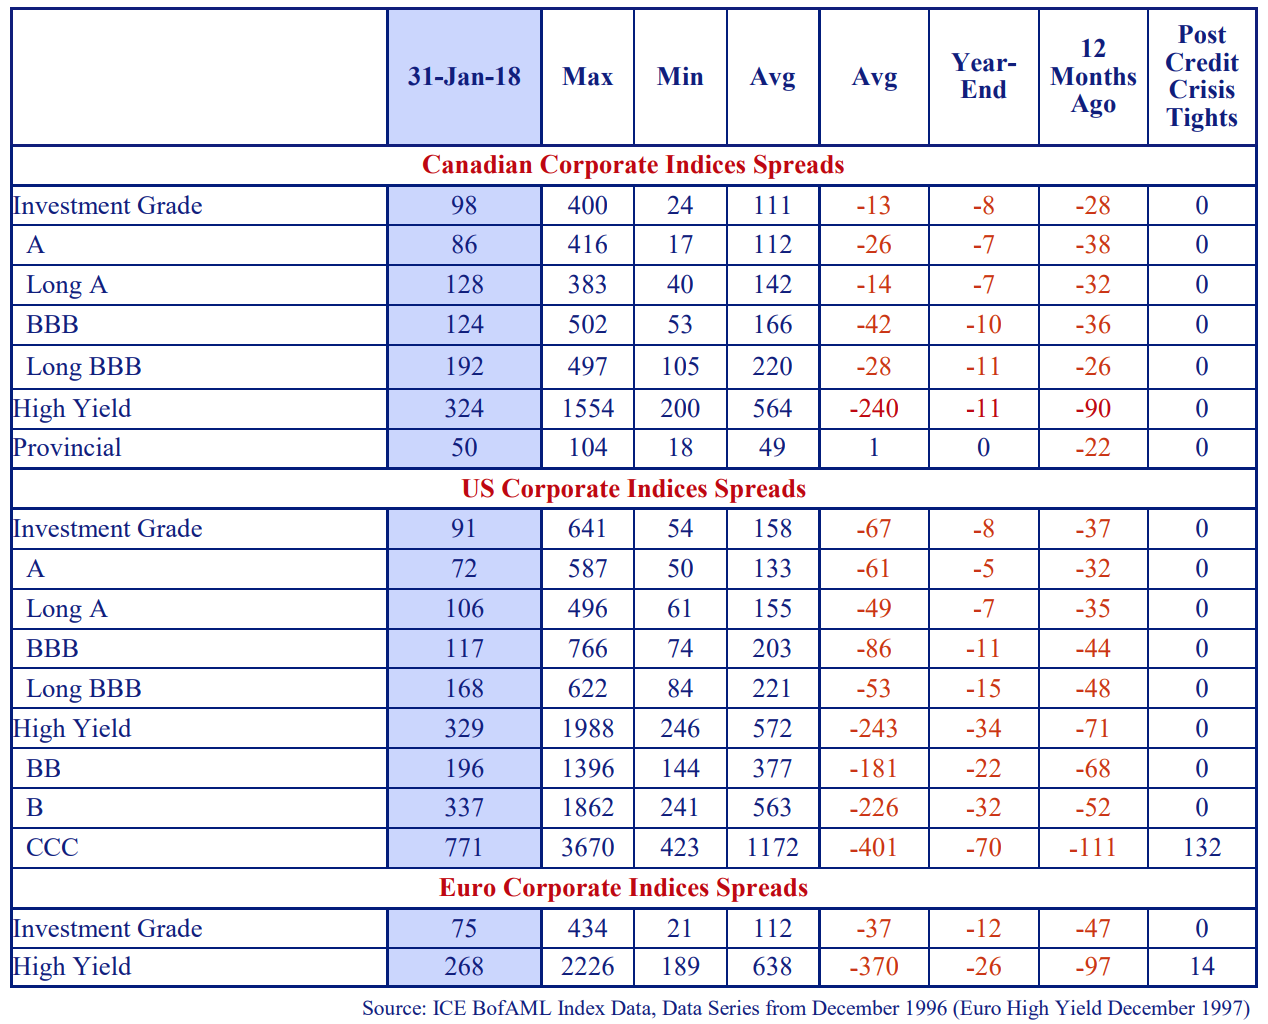
Corporate bond credit spreads are at their lows as investors pile back into the very bonds they shunned during the Credit Crisis. High yield bonds and leveraged bank loans are the bond bistro specials of the day. Even the very bad “acronym bonds” like CDOs (Collateralized Debt Obligations) and CMBS (Commercial Mortgage Backed Securities) are back in vogue. Back, front, screen or trap – no matter what door you looked out of over the last 24 months, credit spreads were tighter. Canadian investment grade spreads tightened 28 bps over the last 12 months and are now 13 bps through long term averages. US investment grade spreads stand 37 bps tighter over the last 12 months and are 67 bps through historic averages.
Get Off of My Cloud
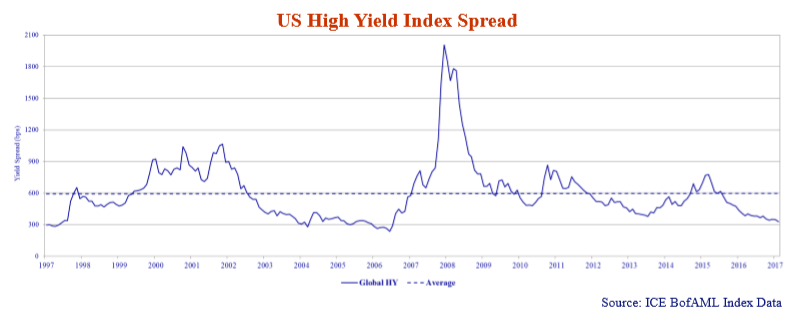
The investor reach for yield has manifested itself most dramatically in the high yield market as the chart below shows. The US high yield index is 71 bps tighter than 12 months ago and 243 bps through its historic average. BB high yield spreads of 196 bps are on top of Canadian long BBB spreads of 192 bps.
From January 2016 to January 2018, the spread on the ICE High Yield Index (formerly the ML High Yield Index) fell 448 bps. Over the same period, yields dropped from 9.2% to 5.8%. The risk premiums paid by lower quality corporate borrowers declined sharply at the same time as terms and conditions moved decidedly in their favour at the expense of lenders. It’s a borrowers market. The reach for yield was best summarized in the title to a recent Barron’s article “It’s Not Too Late to Invest in High Yield Bonds.”
“Ard Times” Ahead
No better example of the unbridled optimism in the high yield markets exists than the recent issue by ARD Securities Finance SARL (“ARD”). ARD is a holding company which owns ARD Finance S.A. (“ARD Finance”), another holding company, which in turn owns 92% of Ardagh Group S.A. (Luxembourg) (“Ardagh”). Ardagh is a real company which makes metal and glass packaging for many of the world’s leading food, beverage and consumer brands. It employs 23,500 people in 109 facilities in 22 countries.
ARD recently issued US $350 million “Super Payment in Kind Notes” due 2023 with a yield of 8.75%. Proceeds from the issue were used to pay a dividend to shareholders, but not all of them, just the small group of original private ones including Ardagh’s Chairman. The notes were rated Caa2 by Moody’s. So what’s the fuss? There are several fusses.
First, the notes rank behind €1.5 billion PIK Toggle Notes issued at ARD Finance which in turn rank behind €7.0 billion in debt at Ardagh itself. Second, on a consolidated basis, the Group has €8.8 billion in debt dependent on €1.4 billion EBITDA to service its debt obligations. This is a leverage ratio of 6.4X. Finally, if cash flow is not available to dividend to a holding company to dividend up yet again, then no interest will be paid on the notes and the interest obligation will be met by issuing more notes. Giving someone the option to pay interest in additional notes means you better be willing to accept more notes! Like walking on broken glass.
Why You Always Picking On Me?
Bombardier attracts more negative attention than any other Canadian company we know of. In Canada, the right wing conservative media types hold it up as an example of government largesse to the private sector. The left wing liberal media like to paint it as an example of private sector evil doing. Shareholder governance experts rail against their family control stake while giving Google and Facebook a pass. Even the boring civic politicians and bureaucrats of “Toronto the Good” use Bombardier as their punching bag for a subway contract.
Since Bombardier dared to create the first “fresh sheet” airliner in many years which is a technological marvel, it even attracted the attentions of Boeing and the Trump administration who tried to kill it with a frivolous, if not inane, trade action. We received many questions on our Bombardier investment in its darkest hours. If everybody agrees it is worthless, went the argument, why do you dare to think it is worth something? There is a good reason we don’t comment on our investments in the press or go on the endless financial TV shows to “talk up our book”.
We let our returns speak for themselves. Risk not, profit not, as we say to our younger staff. We assume risk when we are compensated for it. Assuming risk just because you need to invest your cash and/or the investment in question is heavily promoted by investment dealers is not a great investment strategy, however that is the consensus way.
Unlike Bombardier, we think the ARD deal is a classic late cycle example of investors reaching for yield without considering the downside risk.
Play Your Cards Right
As our followers know, Canso often lends to companies with operational and financial challenges. We don’t always lend on a secured basis, we don’t always sit at the top of a company’s capital structure and we don’t always get the benefit of pristine covenant packages. However, as a rule we know it is better to be close to the cash flows and to limit the distance between us as lender and the assets generating that cash flow.
We attempt to negotiate terms in transactions to optimize recovery in a downside scenario. Our Maximum Loss discipline is the lynchpin of our investment process and drives our position sizing. Two companies with dramatically different credit ratings may have an identical Maximum Loss. For example, our Canso rating for Apple is AA versus Postmedia at BB-. Our Maximum Loss for both is 1. We have difficulty envisioning a scenario where we would lose money on either.
Better Safe Than Very Sorry
As we have said many times, we only assume risk at Canso when we are compensated for it. We have cautioned of looming interest rate increases for some time now and the value destruction these increases would cause to longer duration portfolios. More recently we’ve warned of the danger presented by tightening credit spreads and the erosion of covenant protections.
The risk in our portfolios is the lowest it has been for some time. We are often asked what we will do if yields stay low and spreads stay tight for a prolonged period of time. We do not time the market. It is our individual bottom up security selection process that has led to more conservative portfolio positioning from both a credit and interest rate perspective. When high quality bonds are the cheapest investment, we own them. When bonds are trading at yields below inflation, we don’t think they are good value. We believe it is better to be early as the consequences of being late are too severe. Our portfolios are better safe than very sorry!
Selling Pressures Grow
At the time of writing, we are seeing carnage in the stock market as people who could not see any risk a few months ago are now throwing in the towel and selling risk assets. The mania in cyber-currencies is giving way to despondence as Bitcoin has plunged from $20,000 to $8,000. Market pundits who were cheering on the upside, including President Trump, have gone silent. As always, selling pressures grow as markets fall.
The consensus rationale for the stock market sell off has been rising bond yields. The funny thing about the last few days of terror is that bond yields have dropped. The hope seems to be that the Fed will ease up on its rate increases for fear of financial calamity. The new Fed Chair, Jerome Powell, has his work cut out for him. Economic fundamentals argue for higher interest rates but the markets and President Trump will be screaming for lower rates.
Are things getting cheap enough to buy? Perhaps, but based on the prior market ebullience, we think there is more downside ahead.
