Hard Times in the Markets
“It’s the hard that makes it great” as Tom Hanks described the game of baseball in the 1992 film A League of Their Own. Given the incredible run and crushing end to the Toronto Blue Jays recent season we thought it is an appropriate quote to start the October 2015 Canso Corporate Bond Newsletter. Ask any player on the Toronto Blue Jays and they’d agree with Jimmy Dugan’s assessment. The financial markets can be equally hard and unyielding. Competition is tough, mistakes are magnified, and the obvious path is often only evident in hindsight. To add to the fun there are always many rear view critics waiting to tell you where you obviously went wrong. As our clients and readers know, that’s why we concentrate on our internal research and analysis and take the investment path not well trodden. It’s not the most popular or fashionable investment course to follow, but we find it the most profitable.
Surprise, Surprise, Surprise!
The turbulent markets of the 3rd Quarter of 2015 were difficult and surprising. As Gomer Pyle USMC used to say: “Surprise, Surprise Surprise …”. The Bank of Canada followed their January surprise 25bp rate cut with another less surprising but equally ineffective 25bp cut in July. In the US, the Federal Reserve deferred the inevitable rate rise once again after widely broadcasting their intention to raise them, leaving rates unchanged in September. The Chinese surprised their stock market by applying centralized economic planning to stem their market rout and threw in a currency devaluation for good measure. This central bank action and inaction combined with the economic slowdown in China, commodity market weakness and corporate debacles at Glencore and Volkswagen to drive equity markets lower and government bond prices higher. As the dust settled on Q3 unless you owned Canada bonds through the quarter you were probably left licking your wounds in the dugout wondering what was coming next.
You Shake My Bones and You Rattle My Brain
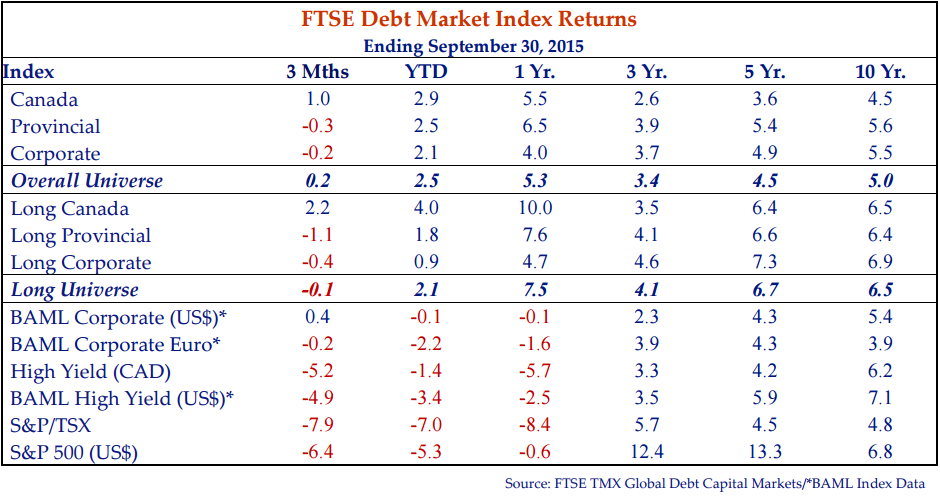
This latest quarter was challenging as the table on the previous page shows. Yields fell, credit spreads widened and equity markets took it on the chin. Falling government bond yields resulted in a positive 1.0% return for the FTSE TMX Canada Bond Index pushing the Universe Index to a slim 0.2% return. Financial market confusion and uncertainty widened credit spreads with lower rated segments the hardest hit. The corporate bond market returned -0.2% for the quarter modestly outperforming the provincial and municipal markets which were down -0.3% and -0.4% respectively.
True Grits
On October 19th the Liberal Party lead by Justin Trudeau pulled off a stunning win in the Canadian federal election by defeating long time Conservative Prime Minister Stephen Harper. With an unexpected majority win, Canadians and financial market participants now wait for Prime Minister – elect Trudeau’s cabinet selections and initial policy decisions. What does a second generation Trudeau government mean for the financial markets? Initially the markets largely shrugged off the news with the Canadian dollar selling off ever so slightly and bond yields rising a few basis points. Trudeau intends to run deficits to rebuild infrastructure and stimulate the economy through deficit spending. He will raise taxes on the “One Percent” to help pay for it. We have suggested for some time the Canadian economic miracle touted by politicians in the aftermath of the Credit Crisis was less miracle and more mirage. An overheated residential real estate market fueled by low interest rates coupled with a Chinese demand led commodity boom propped up the “miraculous” Canadian economy while others around us faltered. The recent fall in commodity prices exposed Canada’s commodity dependence. Despite the fall in the Canadian dollar, the gutted manufacturing sector of central Canada is sputtering, not humming. If nothing else a change of sovereign government attracts attention from the international investment community. We believe when investors revisit the Canadian story they may be less than impressed with substantial deficits in Alberta and Ontario and now soon at the federal level. The overheated Canadian residential real estate market and less than stellar manufacturing sector also do not shout confidence. We think that both Canadians and foreigners will begin to understand the rather weak underpinnings of the “Canadian Economic Miracle”. This all could very well add up to international selling of Canadian federal and provincial government securities, putting upward pressure on Canadian government yields that are still substantially below US yields. It could also mean further downward pressure on the Canadian dollar. There is no doubt the first task of Trudeau’s choice of finance minister will be to settle the nerves of the international community.
An Object At Rest Tends to Stay At Rest
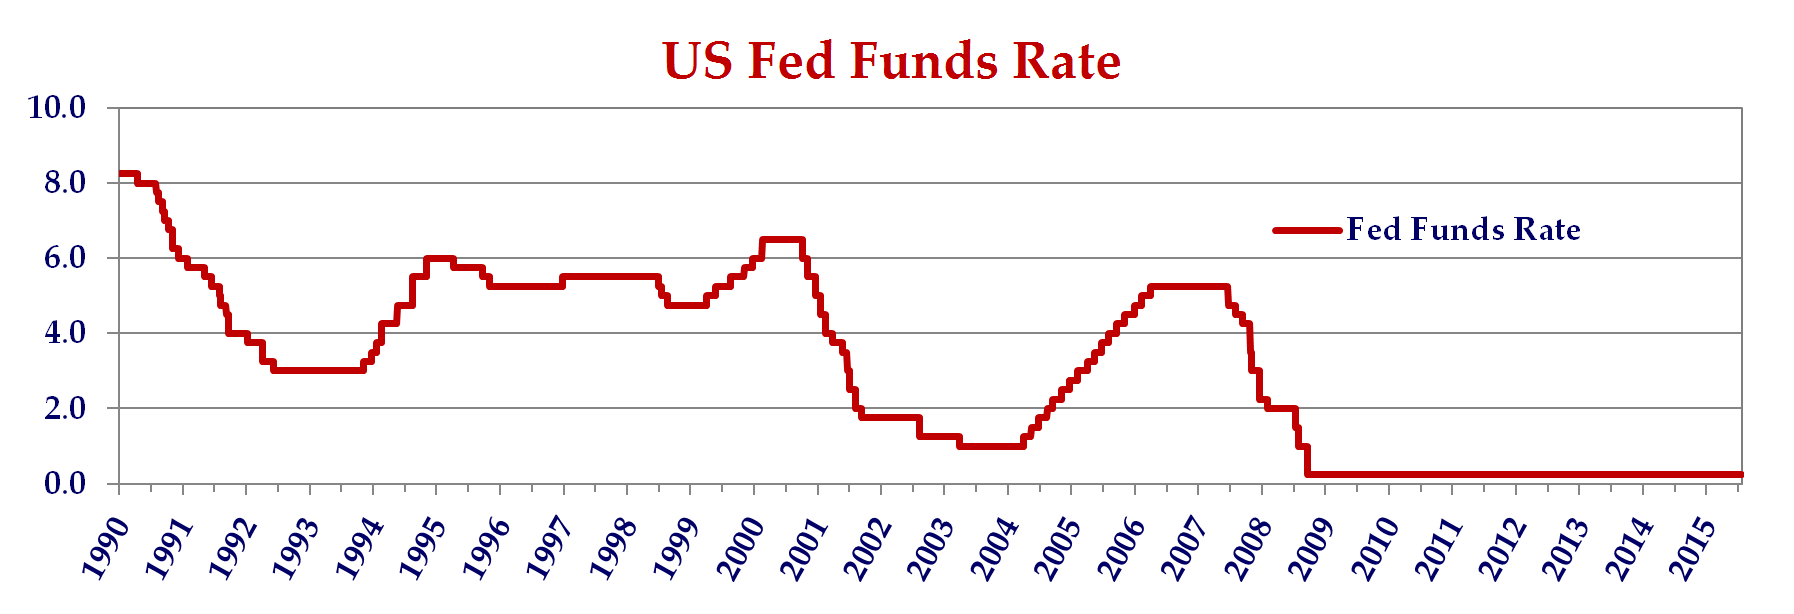
Newton formulated his First Law, that an object at rest tends to stay at rest, in 1687 only seven years before the establishment of the Bank of England and only a few years after the creation of the world’s first and oldest central bank, the Bank of Sweden. It is unlikely Newton expected this law to apply to the interest rate setting machinations of central bankers, but it seems to inform the inaction of the current US Federal Reserve. It has been nine years since the Federal Reserve last raised its Fed Funds rate. The Fed increased the target rate to a now seemingly stratospheric level of 5.25% in June 2006. For nearly seven years the Fed Funds rate has been a barely perceptible 0.25% and people have become used to having money available for virtually nothing. That the markets panic to think it might rise to 0.5% shows that Newton was right in a monetary sense
Newton’s law states an object will stay at rest unless acted on by an external force. We would suggest economic growth coupled with reduced unemployment in the US would qualify as external forces but apparently not. Acting against these forces is economic weakness (or fears of weakness) in Europe and Asia and a growing chorus of international policy makers begging the US to remain accommodative. All of this has conspired to keep the Federal Reserve at rest rather than putting it into motion. There must be some very comfortable recliners inside the Federal Reserve. Contrast the Federal Reserve to the Bank of Canada who with virtually no external force decided to lower Canadian overnight rates not once but twice so far in 2015. No doubt the Federal Reserve receives an abundance of advice on what it should do and when it should do it and it probably doesn’t care to hear Canso’s advice on the matter. Nevertheless we think the Fed should have raised rates in September, if not sooner and they have a long, long way to go to get back to anywhere near normal.
It’s The End of the World As We Know It
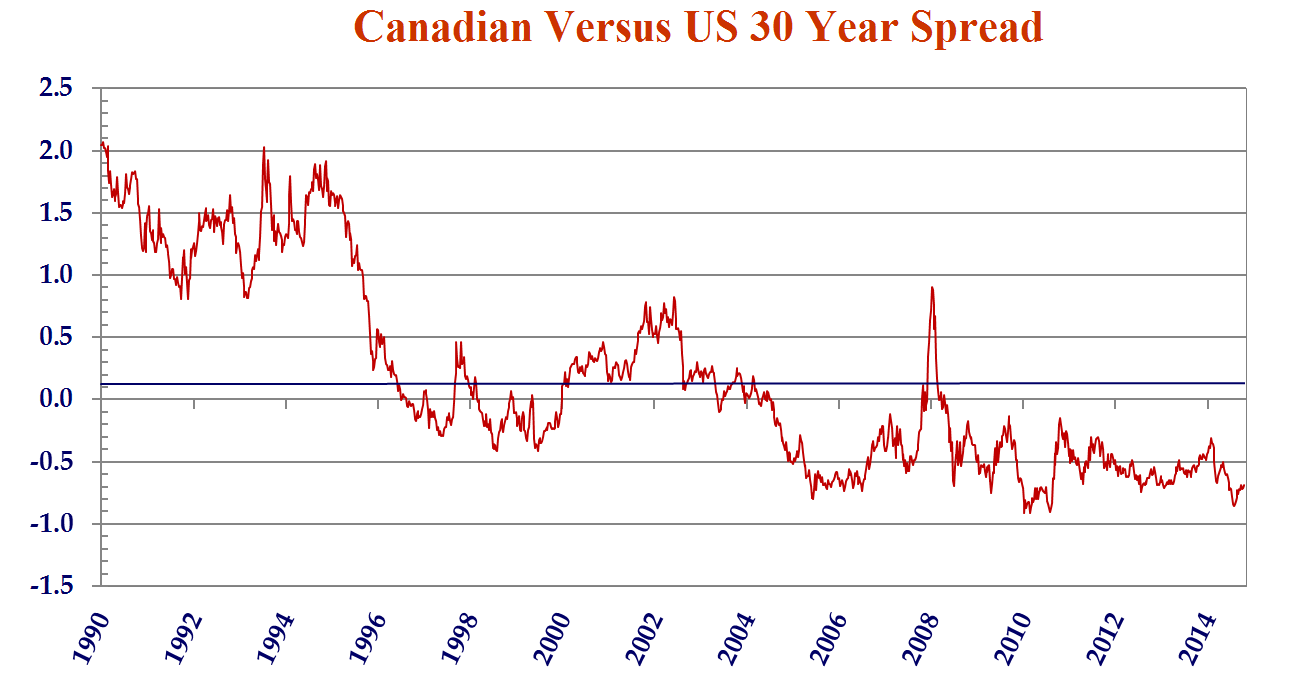
With the exception of the very front end administered by the Bank of Canada, Canadian interest rates have been consistently below US interest rates for most of the millennium. Possible reasons include the extended commodity boom for much of this period and perceptions of Canadian fiscal and financial prudence and the opposite perception in the US. Today we feel comfortable stating the economic challenges facing Canada are significant. Weakness in the oil and gas and manufacturing sectors, and deficits at the provincial and now at the federal level pose significant challenges for Canada. Couple these challenges with an expected move by the Federal Reserve and we expect Canadian rates to start to move higher. At a minimum we think the current environment justifies Canadian rates higher than the US, which is now very much not the case. To that end we present the chart above which shows the spread between Government of Canada 30 year bonds and comparable US Treasuries. Canada 30 year bonds are currently 59bps lower in yield than the US comparable (10 years: 53bps, 5 years: 50bps). Even if the Bank of Canada and the Federal Reserve choose a “stand pat” approach we think the fundamentals should dictate Canadian interest rates moving to and above US rates.
Risky Business
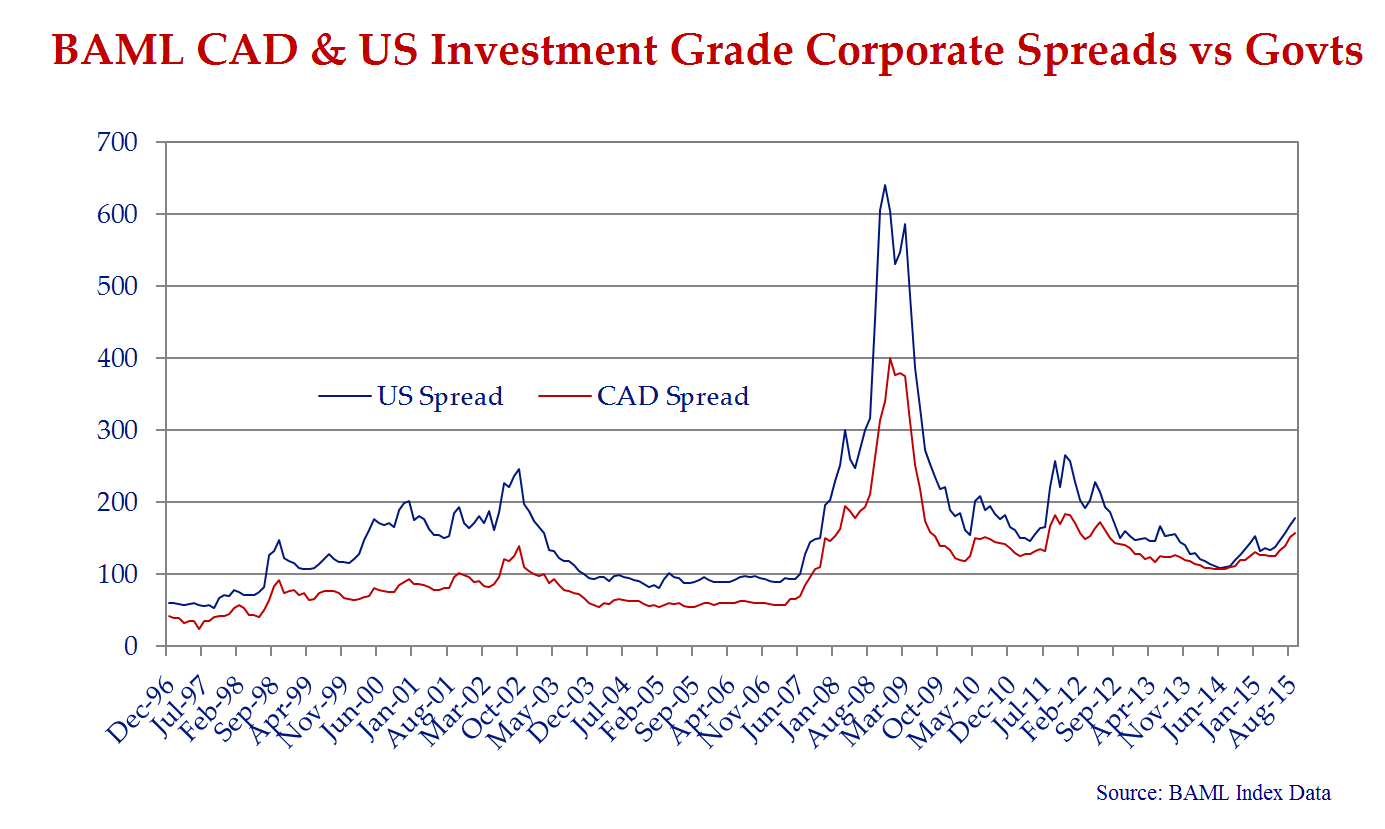
At Canso, simply put, we lend money. We lend money to large financially robust companies such as BCE and Royal Bank of Canada, some companies you may have never heard of such as Depfa ACS Bank and Xplornet, and some companies who have their fair share of challenges such as Blackberry and Bombardier. The crucial assessment a lender makes is the appropriate level of compensation for the risk the borrower is unable to pay us back. In the credit markets this compensation takes the form of a credit spread above the risk free rate of a comparable term government bond.
The chart above presents the spread of the investment grade bond indices in Canada and the US. Spreads are wider in both markets since reaching post Credit Crisis tights in June of 2014. In Canada, average spreads for investment grade bonds are +158bps, 51bps wider than June 2014 and 50bps wider than their historic average. In the US the comparable spread is +178bps (69 bps wider and 17bps wider than June 2014 and their historic average respectively).
Six Months In a Leaky Boat
Ok maybe more like 15 months in a leaky boat but then again New Zealand’s Split Enz was not singing about the corporate bond markets way back in 1982. As shown above aggregate credit spreads have moved wider over the last year. We provide a detailed breakdown by different credit quality parameters in Canada and the US in the table below.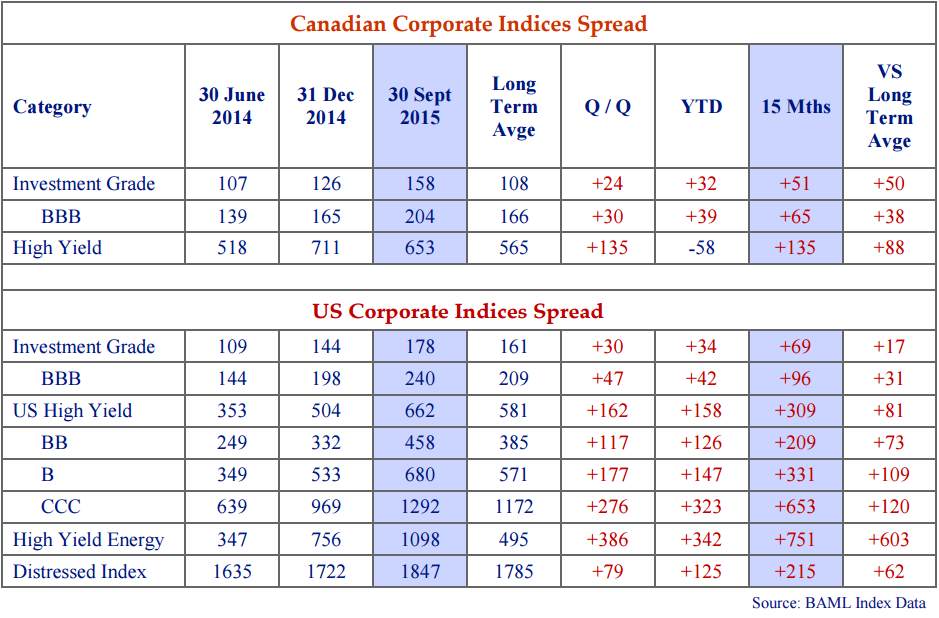
The table clearly illustrates that challenging financial markets cause the risk premium demanded by investors to increase. The lower the rating category the larger the increase in risk premium. Nevertheless spreads are significantly wider across all rating categories. In both Canada and the US the Investment Grade indexes are now significantly wider than their historic averages. Spread widening is more pronounced in the lower rated segments of the credit markets. In Canada BBB bond spreads average +204bps, 65bps wider than June 2014 tights and 38bps wider than their historic average. In the US BBB bond spreads average +240bps, 96bps wider than June 2014 tights and 31bps wider than their historic average. The Canadian High Yield Index finished September at +653bps or 135bps wider than June 2014 and 88bps wider than its historic average. In contrast the US High Yield Index finished at +662bps or 309bps wider than June 2014 and 81bps wider than historic average. The US High Yield Energy Index is at +1098bps, 751bps wider than its June 2014 tight and 603bps wider than its historic average. Spread widening across geographies and rating categories has created some opportunities within both the investment grade and high yield universes.
Trouble With the Curve
We reference aggregate spread data to give our readers a sense of the general level of risk premium and related trends in the credit markets. We thought it would instructive to dig a bit deeper and highlight the difference in spread levels by rating and term.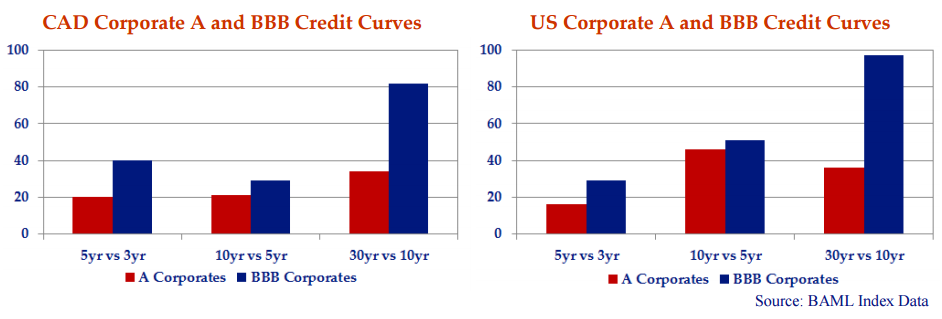
The charts above show the credit curves for A and BBB rated corporates in Canada and the US as generated by the BAML Index data. The curves indicate lenders require incremental spread to lend for longer terms and to lower quality credits. As an example in Canada a lender to a single A rated corporate will require an additional 34 bps to lend for 30 years versus 10 years. For a BBB rated corporate, a lender will require an additional 82 bps.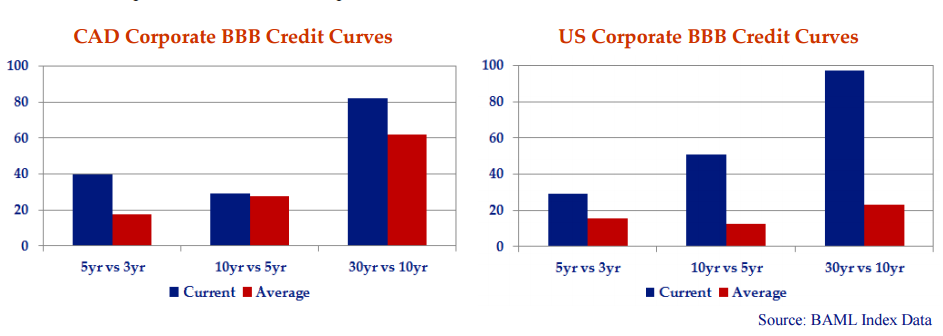
The charts above illustrate for BBB rated credits in both Canada and the US the current steepness of credit curves is higher than the historic averages. In Canada this steepness is most pronounced at the front end (5 year vs 3 years) and the long end (30 year versus 10 year). In the US this steepness is across all terms.
A Nickel Aint Worth a Dime Anymore
With apologies to Yogi Berra (1925 – 2015). The spread widening noted above significantly impacted the return of the major credit indices. Note on the table below, the 1 year returns of -21.7% on the US High Yield Energy Index and -37.6% on the US Distressed Index.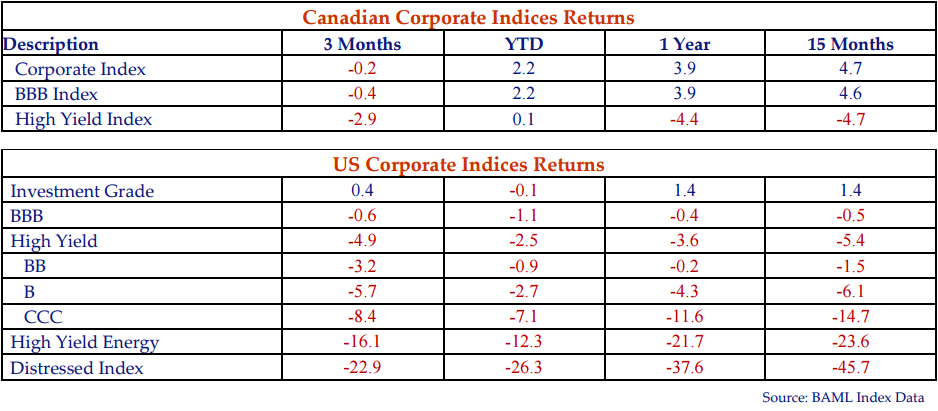
American Made
The Canadian and US credit markets differ in a number of ways. Many of these we have discussed in previous Corporate Bond Newsletters including the US’ significantly larger BBB corporate market, and well developed high yield market and leveraged loan markets. In this edition we highlight the longer duration of the US corporate market.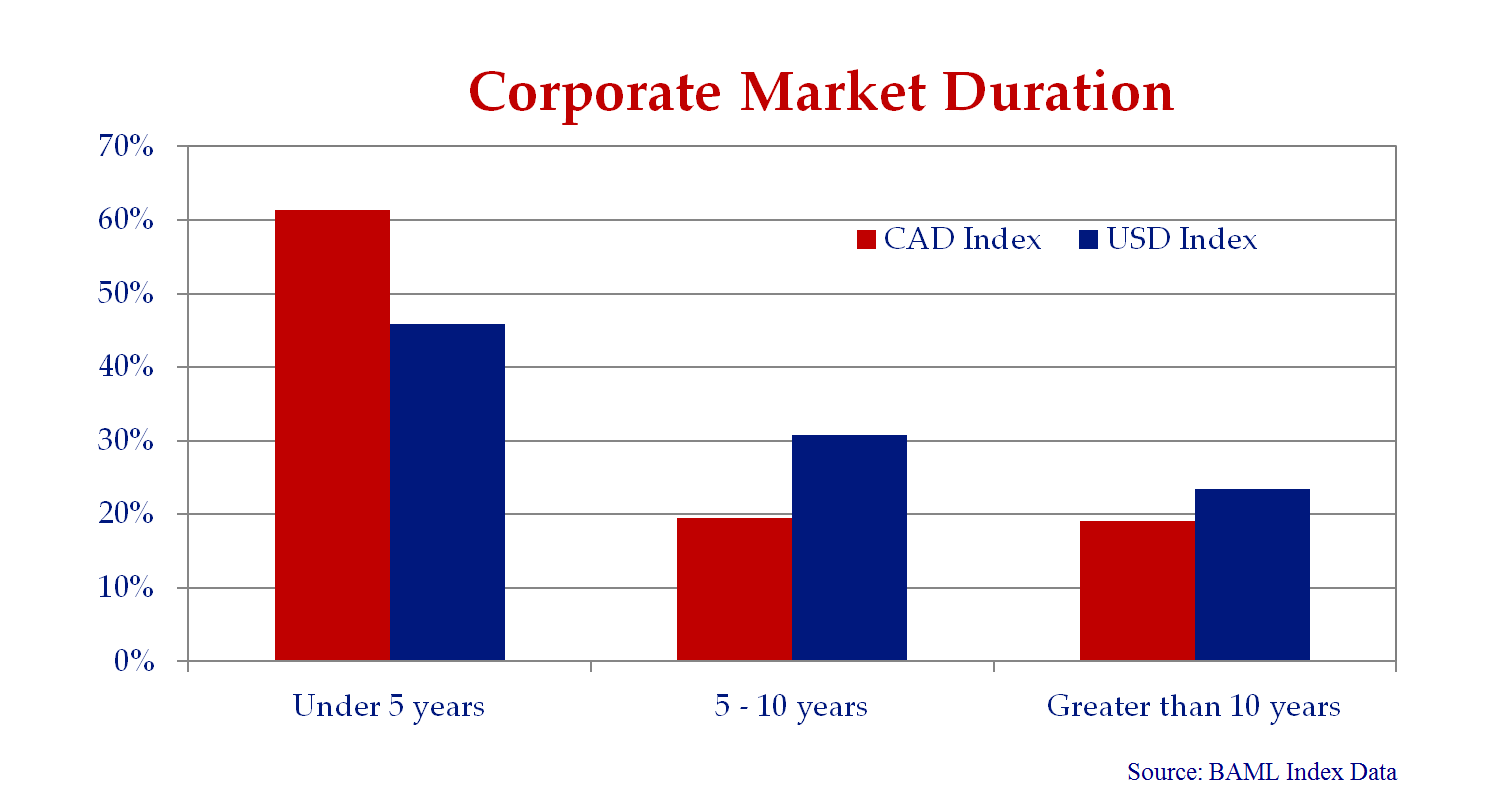
The chart above breaks down the duration of the BAML Canadian and US Investment Grade Corporate Indexes. The Canadian Corporate Index duration of 6.1 is significantly shorter than the US at 6.7. Note bonds with maturities of less than 1 year are removed from the index so the actual duration of the corporate bond market is shorter than the figures stated above.
Ask Not What the Markets Can Do For You…
It is nearly impossible to pick up a financial newspaper without reading an article on bond market liquidity. Implicit in all of the articles and arguments on the topic is that before the implementation of the Volker Rule and Dodd Frank the bond market was flush with liquidity. Benevolent and well intentioned investment dealers utilized their capital for the benefit of investors in the bond markets by stepping in fearlessly when a buyer could not be immediately matched with a seller and vice versa. The reality could not be further from the truth. Any investor who lived through the Russian debt crisis and Long Term Capital in 1998, the dot-com bubble in 2000, the Credit Crisis in 2008 and the Euro debt crisis in 2011 (first edition) understands that there was no liquidity in those periods when markets needed them most. Our experience suggest during times of stress and duress investment dealers with bloated inventories of credit products make for poor counterparties. We have also never met a corporate bond trader who buys something that he or she expects to fall in price. The good news is that although investment dealers might not be buying bonds they also can’t short sell them or carry negative inventories. We believe this will be a positive development that most commentators don’t really understand.
Feliz Navidad Petrobas
In June of this year Petrobras Global Finance issued USD$2.5 billion 6.85% 100 year bonds. The bonds were priced at $81.07, a healthy discount to yield 8.45% (currently trading at $66.875 to yield 10.24%). Petrobras is a publicly traded Brazilian oil and gas company. The Brazilian government maintains voting control and is responsible for regulating PetroBras’ activities within Brazil. Why anyone would lend money for 100 years to even the most pristine of credits is beyond us. In the case of Petrobras we note the company’s reserve life is only 17 years making a 100 year credit extension a significant leap of faith. As always we sought enlightenment in Petrobras’ disclosure and picked up a few gems for our scrapbook (see below). No doubt this issue was an early Christmas present for Petrobras management and shareholders.
Working at the Car Wash
As credit analysts our assessment of the downside risk of an investment is paramount. Sometimes this assessment requires hours of painstaking debate over the meaning of a clause or term in a trust indenture. Sometimes however the risks just jump off the page. The following quotations are taken from Petrobras’ latest 20-F filing dated May 15, 2015. Items in bold are Canso reflections.
In 2009, the Brazilian federal police began an investigation called “Lava Jato” (Car Wash) aimed at criminal organizations engaged in money laundering …the Prosecutor’s Office focused part of its investigation on irregularities involving Petrobras’s contractors and suppliers and uncovered a broad payment scheme … oh boy! The filing of this annual report…was delayed because we required additional time to complete disclosure…to describe material weaknesses in our internal control over financial reporting. say what?
“Car Wash” revelations aside its seems Petrobras faces some other financial challenges outlined elsewhere in the same document. These include:
We have substantial liabilities and are exposed to short-term liquidity constraints, which could make it difficult for us to obtain financing for our planned investments and adversely affect our financial condition and results of operations…really?
…we have incurred a substantial amount of debt…as our cash flow from operations in recent years has not been sufficient to fund our capital expenditures, debt service and payment of dividends …Petrobras total debt totaled US $132.1 billion at December 31, 2014
Our management has identified material weaknesses in our internal control over financial reporting… which may have a material adverse result on our results of operation and financial condition… yikes!
At Canso we believe the financial markets are inefficient – sometimes remarkably so. The Petrobras 100 year bond is an example of investors reaching for yield – by extending term (a bunch) and moving down the credit curve (a bunch). The transaction and related disclosures highlight why we read documents so carefully. Lava Jato indeed.
Promises Promises
We find it somewhat ironic the same week Petrobras borrowed 100 year money from the capital markets the G7 leadership pledged to stop burning fossil fuels by the year 2100 – a mere 85 years in the future. The promise is so unlikely that even the carbon loving now outgoing Canadian Prime Minister Stephen Harper felt comfortable signing on. Nevertheless we applaud the leaders of the free world for making such a strong declaration on something so important. Making promises to alter one’s behaviour so far in the future seems a rather comical proposition. Imagine telling your partner you plan to lose weight starting in 2050! It is also highly probable no one attending this historic edition of the G7 meeting will be around to celebrate the end of fossil fuel use at the turn of the next century. 100 years is a very long time and 85 years seems almost as long. Consequently we expect Canadians will continue to make the Ford F150 the best-selling truck in Canada for the foreseeable future.
Will You Still Love Me Tomorrow
In periods of market uncertainty we are frequently asked how has the recent market turmoil altered Canso’s approach to managing money. What is Canso going to do differently? Implied in this question is a belief that somehow altering one’s approach in the middle of crisis is the sensible thing to do. We completely disagree.
As a long term investor, Canso looks to take advantage of market opportunities as we did in 2008 – 09 and again in the June – September 2011 period. We look to add opportunistically to positions when others are panicking. Our bottom up fundamental approach gives us the confidence to invest in securities others avoid and to avoid securities others are clamouring for. If the markets stumble regardless of the reason, we at Canso would expect to opportunistically pick up cheaply priced assets on behalf of our clients once again.
We realize that this may give rise to periods of underperformance versus the benchmarks against which clients choose to measure us. It is in these periods where we believe we do some of our best work by opportunistically purchasing mispriced securities that will outperform over time.
