The Race Is On!
We hope you and your loved ones are healthy and safe, wherever this note finds you.
Governments across the globe are desperate to return life to normal as quickly as possible from the rolling waves of the COVID-19 pandemic. Countries like China have managed to do this with severe public health measures without regard to politics. New Zealand and belatedly Australia have managed the political resolve to do this in a democracy.
The United States, the European Union and even sensible Canada have lacked the political resolve and have had serial economic and social “reopenings” followed by the re-imposition of stricter regimes. They are now fighting the spread of new COVID-19 variants while simultaneously rolling out their COVID-19 vaccination programs.
The race to vaccinate is now on. The United States, the European Union and Britain have favoured their own citizens for scarce vaccine supplies. This suggests to smaller countries like Canada that perhaps free trade and internationalism are not substitutes for domestic self- reliance.
Just Do It!
Policy makers must have watched Nike commercials and taken to heart their motto of “Just Do It”. The markets and even the U.S. Federal Reserve see a brighter economic future. A bullish Fed revised forecasts for GDP growth to a strong 6.5% from 4.2%. They see unemployment falling to 4.5% from 5.0% while recommitting to rock bottom overnight rates to risk the overcorrection of a strong economy. Inaction is not an option.
Big government is back in vogue and seems to be the answer instead of the problem. The Biden Administration announcement of a proposed $2 trillion infrastructure bill in the U.S. came on the heels of the successful passage of its $1.9 trillion COVID relief package. These huge debt-financed spending programs are very popular with voters, with even a majority of polled Republicans approving.
The Bottom Line
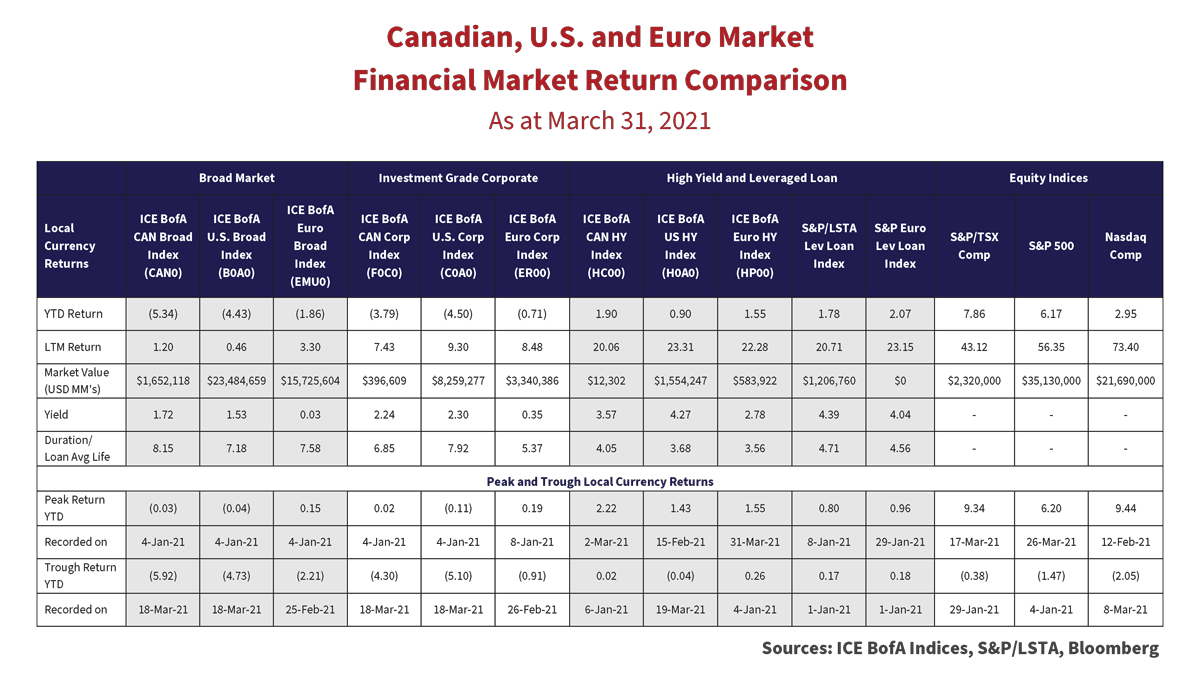
The combination of the Fed’s commitment to near-zero overnight rates and the massive government fiscal support for the economy buoyed equity markets but soured bond markets. As the table below shows, government bonds in Canada and the U.S. recorded two of their worst quarterly performances ever, as mid and long term yields moved sharply higher.

As the table above shows, longer duration assets bore the brunt of higher yields. The government heavy ICE BofA Canada Broad Market Index fell -5.3% in the first quarter, its 1.7% yield no match for the negative price impact of the increase in long term bond yields.
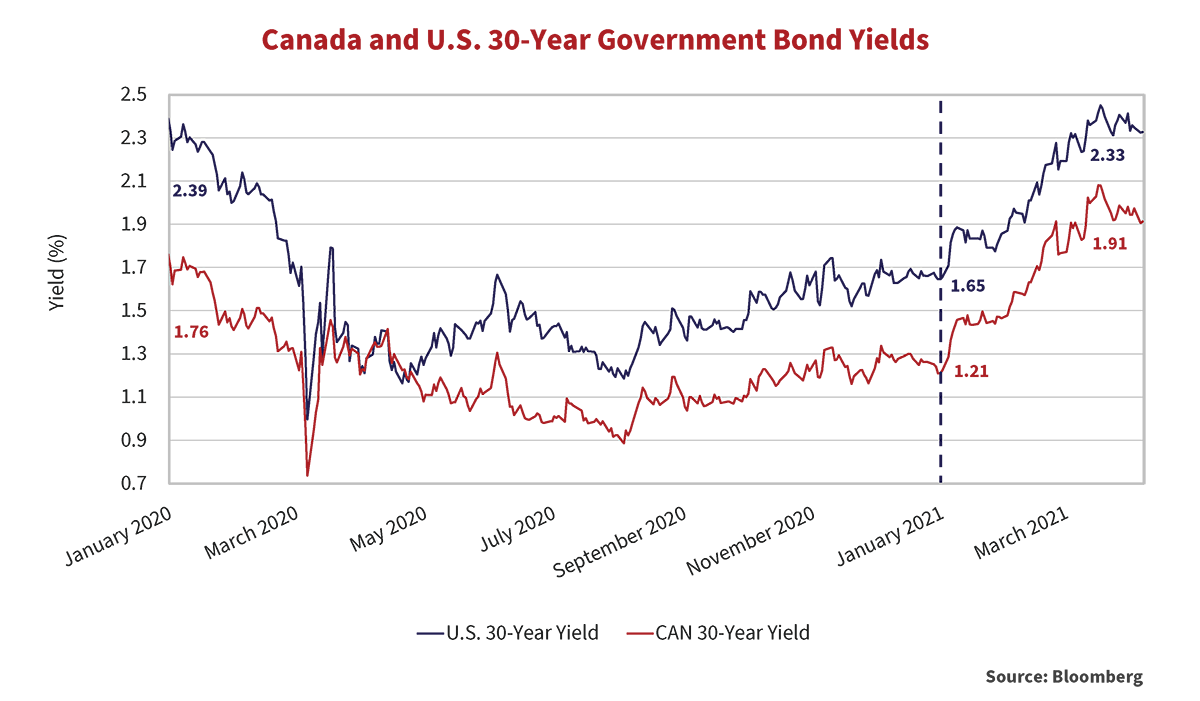
The graph below illustrates the move in long term government bond yields since the start of 2020. The 30-year U.S. Treasury yield increased 0.68% higher this year, retracing to pre-pandemic levels. The 30-year Canada also moved 0.70% higher, 0.15% higher than at the onset of 2020, leaving pandemic lows behind.

Tougher Than the Rest
Rising government bond yields wreaked havoc on investment grade corporate bonds, which fared only slightly better than the broad markets. Corporate bonds benefitted from modest spread tightening in the first quarter but not enough to overcome the impact of higher government yields. The result, an eye opening -3.8% return for the ICE BofA Canada Corporate Index. As the chart below illustrates, first quarter 2021 produced one of the worst quarterly drawdowns since inception of the Index, second only to the rising rate environment of 1994.

Negative returns in the first quarter of 2020 resulted from dramatic widening of credit spreads, offset partially by falling government bond yields. For the balance of the year, credit spreads rallied with government yields moving modestly higher generating positive returns for corporates. With current corporate spreads on top of long-term averages, we do not expect the same reversal of fortunes for corporate returns experienced in the latter part of 2020.
Pause for Thought
The Canadian investment grade market appears fairly valued at 109bps.

At nearly 0.60% inside of historic averages the U.S. investment grade market looks expensive at 91bps.

Spreads may push tighter, but upside potential is limited, and is unlikely to offset the negative price impact if the yield curve continues to steepen. Non-liability based investors would be justified to question the efficacy of continuing to hold longer duration bonds in their portfolio.
Come and Get It!
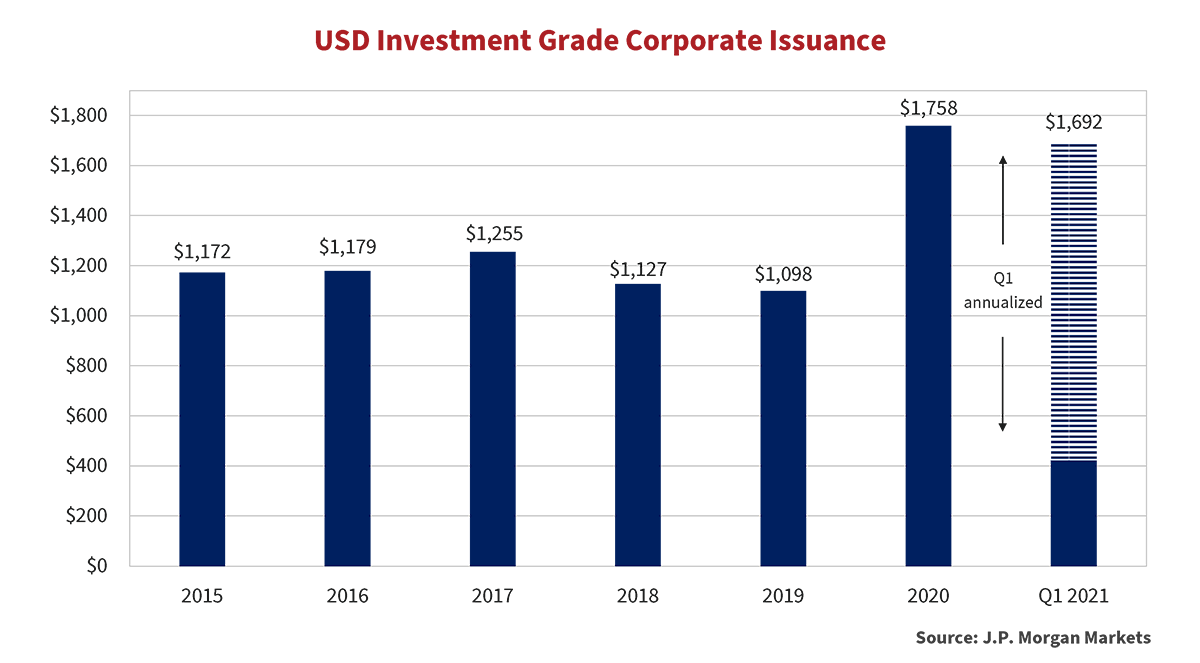
Last year saw record levels of corporate issuance, as companies increased cash positions to carry them through the uncertain pandemic environment. High quality companies termed out debt at attractive borrowing costs. Money put into the hands of investors from governments and central banks provided ample demand.
We entered 2021 bullish on corporate spreads. Our enthusiasm was underpinned by the Fed’s accommodative interest rate stance and the new administration’s supportive fiscal policies. Our expectation of substantially reduced bond issuance in 2021 only furthered our conviction on corporate credit. Surprising to us, a steady new issue stream continued to flood the bond markets in 2021. The chart below shows investment grade issuance in 2021 is on pace to rival that of 2020.

I’m So Excited
Key drivers of new issue activity include still low coupons despite higher government bond yields, ongoing refinancing and prefinancing activity, and merger and acquisition related borrowing. Three transactions by Canadian companies have not resulted in new issues but likely will in the future. Rogers Communications Inc. announced a CAD$26 billion combination with Shaw Communications Inc. Canadian Pacific Railway Limited agreed to acquire Kansas City Southern in a transaction valued at US$29 billion. Sobey’s Inc. announced the purchase of 51% of privately held Longo’s for $357 million.
The Rose
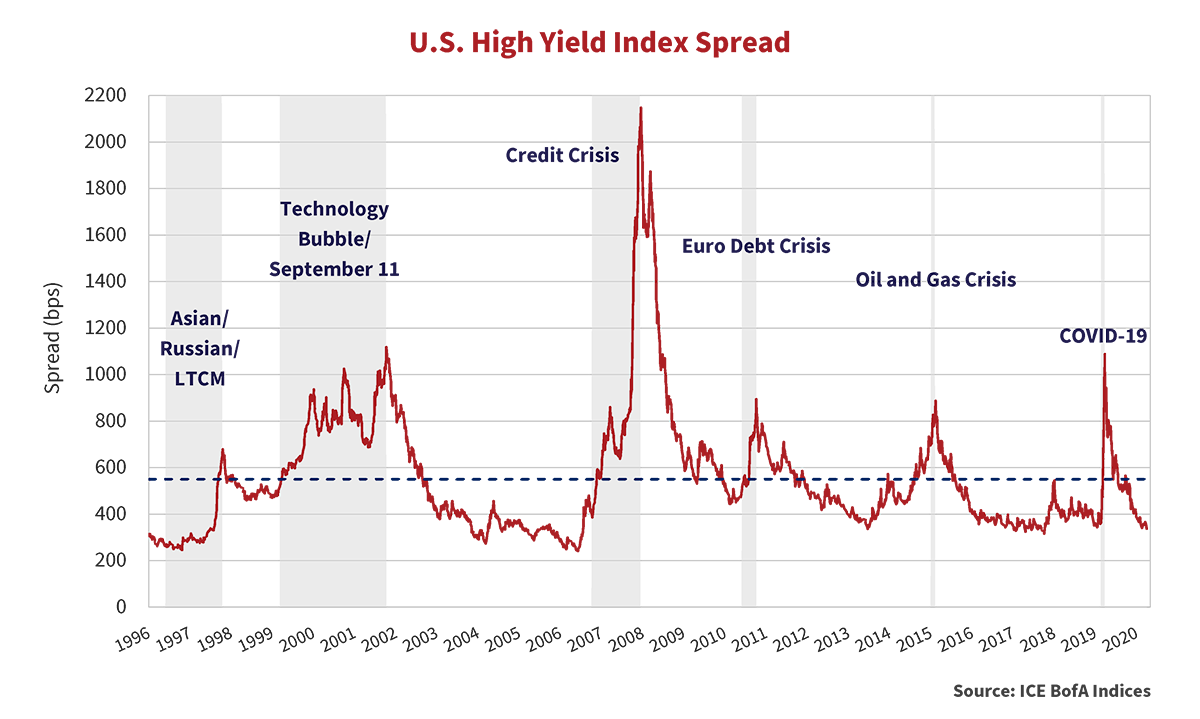
High yield markets continued to perform well in the first three months of 2021. The ICE BofA U.S. High Yield Index returned 0.9% with credit spreads continuing to narrow. Investors fleeing negative returns in investment grade and government bond markets should pause before committing capital into high yield. High yield credit spreads have retraced to pre-pandemic levels and at 353bps are 200bps inside their historic average.

Lower Quality Did Best
A closer look reveals lower quality did best over the pandemic markets. CCC and Distressed Indexes outperformed BB rated bonds over the last 3 and 12 months. This occurred for two reasons. First, lower quality high yield spreads widened more than BB’s in March of 2020, driving prices lower, which in turn created a greater rebound opportunity. Second, in 2020 a large portion of fallen angels were longer term issues, different than the typical shorter high yield maturity profile. The duration of the BB portion of the Index extended 0.6 years to 5.6 years as fallen angels tend to migrate to BB. As a consequence, investors assumed more interest rate risk than historically.

On the Good Ship Lollipop
As with Investment Grade markets, High Yield and Leveraged Loans reported robust new issuance in the first quarter of 2021. According to J.P. Morgan Markets, underwriters brought a record $158.6 billion of high yield issuance and near record leveraged loan issuance of $168 billion in the first three months of the year. Yield hungry investors provided issuers low all-in borrowing costs. The move higher in underlying rates also provided motivation for issuers to access markets to lock-in low financing rates regardless of near-term cash needs.

In spite of higher government bond yields, high yield coupons continued to grind lower, as investor compensation for lower quality risk approached all time lows. The table below details several BB rated issuers able to execute deals with coupons under 3%. This leads us to question whether the term “high yield” is an accurate descriptor. If underlying government bond yields continue to push higher, these issues could come under significant price pressure.

I Will Follow
In 2020, several Canadian banks issued Limited Recourse Capital Notes (LRCN), a new security type in the Canadian market. In 2021, Canadian insurance companies followed suit. Manulife’s $2 billion issue, priced in February, is the largest such issue to date. Banks and life insurance companies’ issues have largely common terms. One major difference is that unlike banks, the LRCN issues of life insurance companies are not forced to convert to common shares when the issuer is deemed to be non-viable. This is a credit positive. Total LRCN issuance since RBC’s inaugural issue in July 2020 stands just shy of $8 billion. We expect the LRCN market to grow.
As junior debt instruments, LRCNs rank below subordinated debt and pari-passu with preferred shares. Coupons reset every 5 years at the prevailing 5-year government of Canada bond yield plus a pre-determined credit spread. LRCNs satisfy tier-one regulatory capital requirements with the benefit of tax-deductible interest. Regulators cap the amount a company can issue based on a percentage of risk weighted assets and/or net AT1 capital.
The LRCN issues to date have been issued at attractive premiums to senior and subordinated debt, providing investors more than adequate compensation for the instruments incremental credit risk. The graph below plots the yield spread of the inaugural RBC LRCN issue versus RBC subordinated and senior debt.

The LRCN yield premium steadily compressed as investor familiarity increased. We expect a continuation of this trend as LRCNs gain broader investor acceptance. It is noteworthy that these securities are not index eligible, which precludes buying by some investors. This incentivizes unconstrained investors to enhance their yield relative to the benchmark.
How Do You Like Me Now?
Issuers clearly prefer the higher capacity institutional LRCN markets over retail driven preferred share funding. The decline of traditional preferred share supply, through lack of issuance and redemption of secondary issues, drove strong price performance in secondary preferred shares. Many discounted fixed-reset issues re-priced close to par in anticipation of being called.
All Risk and No Reward
Strong equity and credit market performance over the last 12 months did not come without additional risk. As equity markets peaked, investment bank enablers turned margin executioners, as investment banks liquidated the highly levered Archegos, a hedge fund unknown outside of Wall Street. Heads rolled at Credit Suisse after announcing a $4.7 billion loss related to Archegos related activities. Despite this, margin lending hit a record high $814 billion as retail investors poured money into stocks. Although not new, Special Purpose Acquisition Corporations (SPACs) continued to enjoy flavour of the month status raising nearly $80 billion so far this year, more than all of 2020, according to Refinitiv.
How Do You Sleep?
As we enter the second quarter of 2021 there are many reasons to be optimistic; the rollout of vaccines is at the top of the list. Accommodative monetary policy, stimulative fiscal policy and pent-up consumer demand bode well for a strong economic recovery.
That said, there are many signs that markets may be running ahead of themselves. The liquidation of hedge fund Archegos, record levels of retail margin debt, and the explosion of SPACS to name just a few. These are signals of a market fueled by speculation rather than based on fundamentals. Catch phrases including “this time is different”, “prudent capital buffers” and “system resiliency” can provide false comfort to investors in times like these.
At Canso, we buy cheap stuff and take risk when our investors are compensated for doing so. As we look back on the last 12 months, and at current valuations, we believe it is prudent to migrate to higher quality, with the exception of special situations, and where possible, to shorter duration assets.