Glad All Over
The Dave Clark Five topped the Pop Charts with the foot-tapping hit Glad All Over in 1964. Fifty years later, Canadian bond investors might be excused for singing this tune after the Canadian bond market extended its impressive run. As the chart below shows, it continued to pay to assume credit and duration risk in the second quarter of 2014.
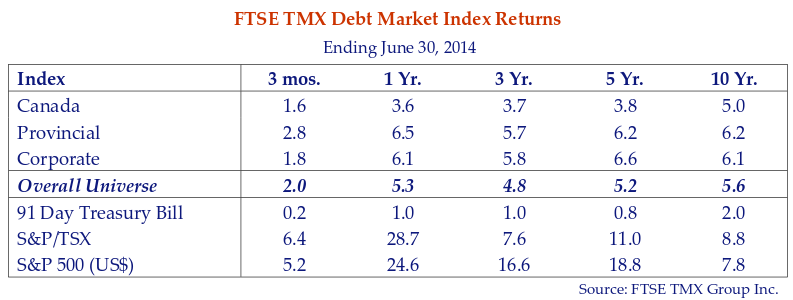
Canada bonds returned a respectable 1.6% and 3.6% respectively over the three and twelve months ended June 30th, 2014. Longer duration provincial bonds benefitted the most from the decline in yields generating strong returns of 2.8% and 6.5% over the same periods. Corporate bonds generated healthy 1.8% and 6.1% returns as spreads continued to narrow.
The bond and stock markets generated these very positive returns in spite of political unrest in the Ukraine, widening troubles in the Middle East and uncertainty regarding the direction of global economic activity. Who wants to spoil the party by pointing out the negatives when they can be “Glad All Over”?
Loose and Loving It
We do not expect this bond market love-in to last. The elimination of the Federal Reserve “Quantitative Ease” (QE) bond buying program and an expected pick up in US economic activity in the second half of this year should lead to the beginning of a normalization of longer term bond yields. Despite the end of QE, Canso expects the Canadian and US central banks to continue to anchor shortterm interest rates at current levels through very loose monetary for at least the next six to eighteen months.
As we have shown in our past newsletters, Canso research shows the historical “normal” levels of short term interest rates are inflation plus 1-2%. With inflation of 2% this implies short rates of 34%. A positively sloped yield curve implies long rates of 5-6%. With long Canada bond yields of 2.78% at June 30 “normal” could mean much higher yields.
“Mommy, is it true that credit spreads only narrow?”
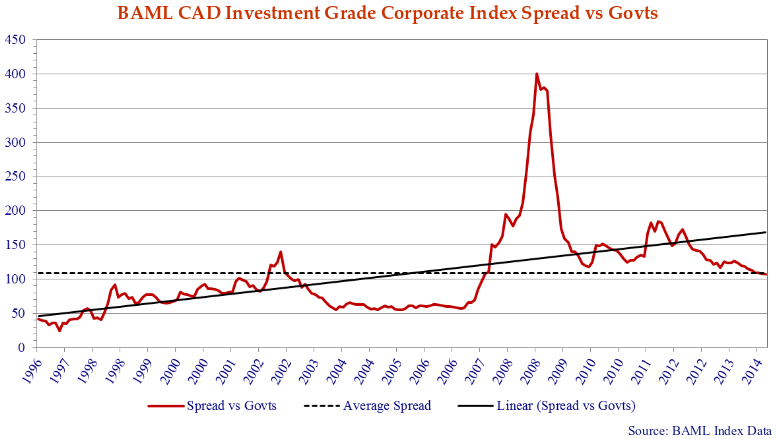
Someone whose bond market experience began in 2009 has generally experienced narrowing Canadian corporate yield spreads and they tightened again last quarter. The BAML Canadian Investment Grade Corporate index closed at a spread of +107bps versus governments, close to its long term average and 2 bps tighter than March 31.
Corporate bonds are more expensive than historical averages in the United States. The BAML US Investment Grade Corporate Index closed at a spread of +109bps versus Treasuries, 10bps tighter than March 31. This compares to the long-term average of +162bps and the current level is very close to pre 2008 Credit Crisis levels.
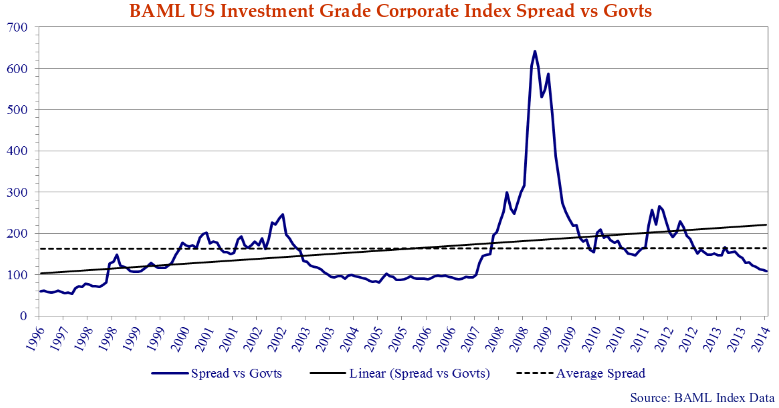
We expect corporate yield spreads in Canada to continue to tighten for some time, although they are nearing full value for many issuers. Spreads can stay narrow for long periods of time in a period of loose monetary policy. In the one and three year periods ending June 2007, Canadian corporate spreads averaged 62bps and 60bps respectively. During the same period, spreads In the U.S. averaged 95bps and 92bps.
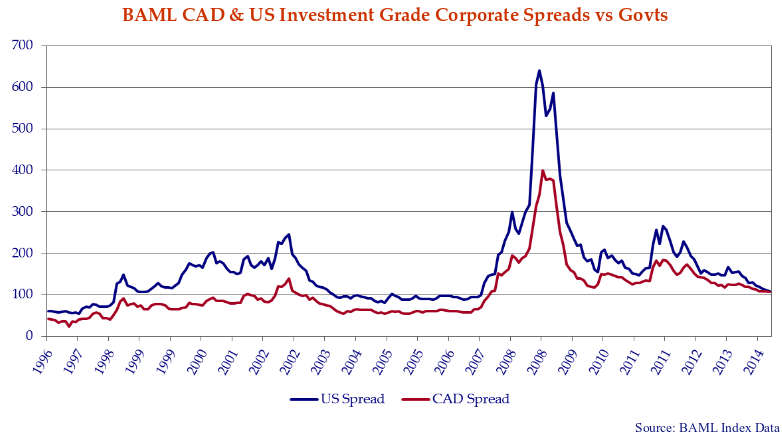
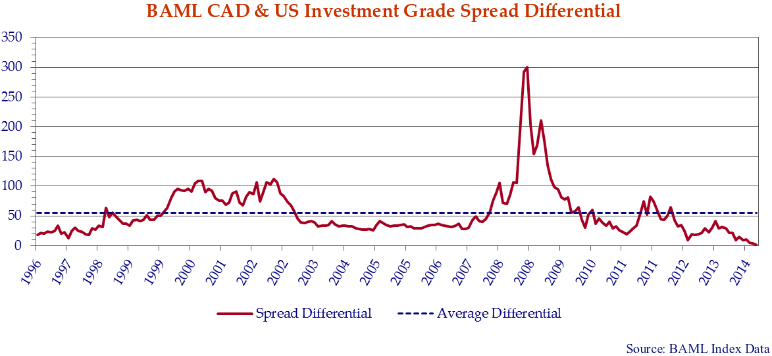
The charts above shows U.S. and Canadian investment grade spreads and we note that U.S. and Canadian spreads are nearly equal for the first time. The chart below shows the spread differential between the two markets. With Canada at +107bps and the U.S. at +109bps, the differential between the two at 2bps is a far cry from the average 55bps over the last 17 years. For the first time ever one might comfortably suggest U.S. corporate spreads are expensive relative to Canada!
BBB or (and) Bust?
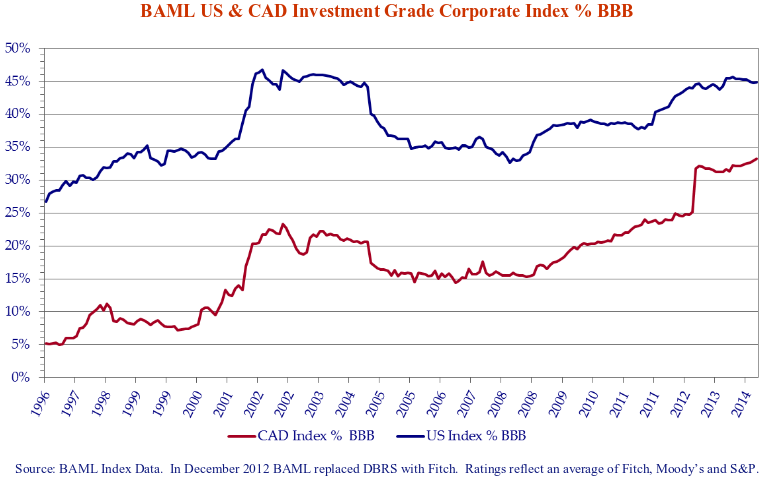
Somewhat unscientifically we attribute some of the relative widening of Canadian corporate spreads versus the U.S. to the reduction in overall credit quality of the Canadian corporate bond market. We highlight the shift in credit quality in the Canadian and U.S. markets in the chart below. BBB rated issues accounted for 33.3% of the corporate market in Canada at June 30th 2014 versus only 5.2% in December 1996. In the U.S. corporate market, the percentage of BBB issuers increased from 26.7% to 44.8% over the same time period. Although the U.S. started at a much higher level of BBB exposure, the formerly staid Canadian corporate bond market has made up much of the difference.
We also believe the widening of Canadian corporate spreads reflects the acquisition of the Canadian Bond Rating Service by S&P which “harmonized” many former “Made in Canada” A rated issuers to BBB in its global rating scale. Long corporate bond issues also tend to trade at much wider spreads in Canada than the U.S.
And You Thought the Sudbury Nickel Was Big
At Canso we consider ourselves “security selection” specialists measuring and attributing value across the capital structure of issuers around the world. We seek to exploit inefficiencies in the global credit markets buying cheap, overlooked and unloved securities. Opportunities present themselves in all shapes and sizes, all markets and all currencies.
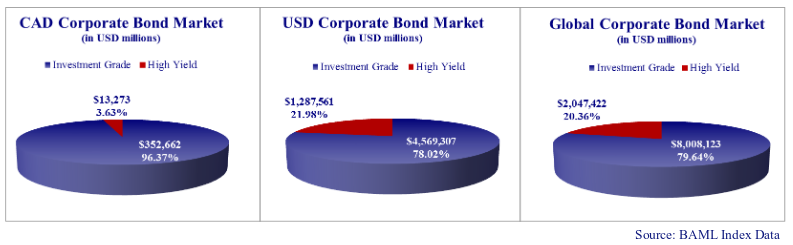
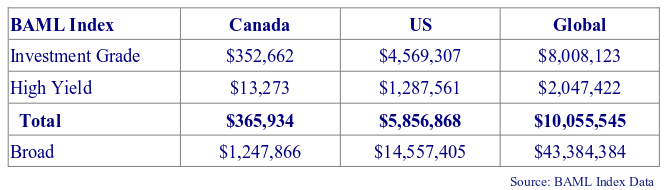
A question we are often asked is just how large is the universe of investable assets. As the vast majority of Canso assets are invested in the corporate bond markets we present below the size and structure of the Canadian, US and Global corporate bond markets as contained in the BAML Investment Grade and High Yield indices. Please note that the Global index includes the Canadian and US indices.
Importantly the public bond markets represent only a fraction of the global credit markets. Bank loans, commercial paper and private placements are also investable credit products. Below are the Bank of Canada’s statistics of the Canadian credit markets.
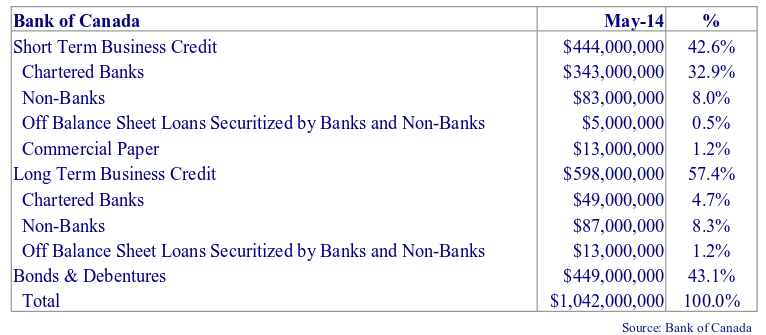
Investment grade and high yield bonds are included in the “Bond and Debentures” figure above and represent 35% of the Canadian credit markets. Applying the same percentage allocations to the global credit markets suggest an investable universe of credit assets approaching $30 trillion.
The figures verify the existence of credit investments in many forms, markets and in significant size. At Canso we are continually surprised (in a good way) that the global credit markets often prove just as inefficient as our local Canadian credit markets. Opportunities can and do present themselves through all market and economic cycles.
Common Sense Light
Around the office we cringe when the terms “covenant light” and “great opportunity” are combined in the same sentence by an over eager underwriter. We have written extensively in previous Corporate Bond Letters about the “madness” in the current U.S. high yield and leveraged loan markets. As we go to press we reassure you, our faithful readers, that the madness continues unabated. Tighter credit spreads, “covenant light” contracts and shareholder friendly transactions are no longer considered pushing the envelope – they are sadly the new normal. We continue to counsel extreme caution when investing in these markets.
We have learned over years of successful investing that it takes a combination of hard work, patience and a willingness to read the fine print. The fine print is found in the Offering Memorandum, Prospectuses, Loan Agreements and that hardest to find of all documents, the Trust Indenture. These are the contracts between borrower and lender and it is the fine print that determines the downside when things do not go as planned.
“Covenant Light” typically refers to the lack of covenants, promises by the borrower to do things, in a borrower’s contract with a lender. Covenant light transactions omit much of this fine print that protects lenders from over-zealous management teams, unexpected changes in business conditions or adverse market conditions. “Maintenance Tests” set a financial metric that must be met for the entirety of the loan. The most common maintenance tests include a leverage test as measured by Debt / EBITDA and a coverage test measured as EBITDA versus Interest. Often times these maintenance covenants become more restrictive over the life of the loan.
Incurrence tests also set a financial metric to be met but unlike maintenance tests need only be met at the time of increased borrowing. Other nuances of borrowing agreements include the use of “pro-forma” EBITDA (most notable in the case of an acquisitions) and “adjusted” EBITDA which may back out or back-in (normally whichever is more advantageous for the borrower) certain costs or expenses or gains which may be non-recurring.
We do not blame companies for wanting to borrow with the fewest possible restrictions and at the lowest possible costs. It is the investors that eschew these protections in their rush “to get invested”. Competition for higher yielding assets from ETF’s and CLO’s and their need to invest fund flows is a key driver in the loosening of credit standards and the emergence of covenant light transactions. It is clear to us that many of these transactions are structured with only upside in mind. As lenders we are paid to manage the downside risk and as such we will watch and wait for better terms from the leveraged markets from the sidelines.
It Always Seems Like a Good Idea at the Time
Despite the regulatory handwringing over “moral hazard” and despondency of investors during the Credit and Euro Debt Crises just a few short years ago, we are now back to markets which amaze us with their lack of credit discernment. In an era of nearly free money, tight credit spreads and indiscriminant lending it seems nearly inconceivable that a company could actually go bankrupt. But then, this was also the case in the lead up to the credit meltdown in 2008.
Back to the Energy Future
In 2007, a period not unlike the present, Energy Future Holdings (EFH) seemed like a great high yield issuer. EFH just entered into a pre-arranged reorganization under Chapter 11 of the U.S. Bankruptcy Code on April 29, 2014. We decide to investigate the “market top” deal to illustrate why a bit of skepticism is sometimes warranted when the market is euphoric and sees little risk.
A quick refresher on EFH is in order. Leading private equity sponsors Kohlberg Kravis Roberts, TPG Capital and Goldman Sachs Capital Partners paid $69.25 per share for TXU Corporation in October 2007, a Texas based energy generation and distribution company. The transaction valued TXU at $32.7 billion. The sponsors contributed equity of $8.2 billion and borrowed another $25.6 billion to fund the purchase. Pre-transaction TXU’s debt totaled $12.6 billion on 2006 EBITDA of $5.9 billion. Post-transaction the renamed Energy Future Holdings total debt measured $40.8 billion on 2007 EBITDA of $2.6 billion.
Just what went wrong at good old Energy Future Holdings? A challenging operating environment? Product obsolescence? Foreign competition? Perhaps something more sinister such as fraud? Rogue foreign exchange trading? International espionage?
The sponsors might blame unlucky timing for Energy Future Holdings demise but clearly too much leverage and over optimistic projections heaped on an otherwise sound business was the root cause. We highlight the notes under Risk Factors in Energy Future Holding’s 2007 10k.
“EFH Corp.’s substantial leverage could adversely affect its ability to raise additional capital to fund its operations, limit its ability to react to changes in the economy or its industry, expose EFH Corp. to interest rate risk to the extent of its variable rate debt and prevent EFH Corp. from meeting obligations under the various debt agreements governing its indebtedness.”
Even in legalese this note sounds ominous, not to be outdone by the next bombshell:
“Despite EFH Corp.’s current high indebtedness level, it may still be able to incur substantially more indebtedness. This could further exacerbate the risks associated with EFH Corp.’s substantial indebtedness.”
Investors need look no further than this transaction to be reminded of the mis-alignment of interests between sponsors and lenders in private equity transactions and the simple perils of borrowing too much. Even good businesses will fail if saddled with too much debt.
While You Were Watching the World Cup
We highlight a few key credit market happenings that occurred while you were watching and cheering your favourite team playing in the World Cup:
- The Federal Reserve confirmed it will end its bond buying program – currently $35 billion per month down from a peak of $85 billion – in October. The end to Quantitative Easing in the US is the first step in normalizing monetary policy and an eventual rise in short term rates.
- The European Central Bank reduced its main interest rate to 0.15%, the rate on its marginal lending facility by 35 basis points to 0.4 percent and cut its deposit rate to -0.1%. European banks now pay the ECB to hold their money.
- Argentina. President Kirchner proved less adept than Lionel Messi dealing with a hostile opposition. Argentina continued to battle with holdout hedge fund managers in an effort to avoid yet another default on their sovereign debt.
- Moody’s Investors Service apparently did not watch any of the World Cup.
- Canadian banks. The outlook on Canada’s seven largest Canadian banks was changed to Negative from Stable citing “the evolving lower systemic support environment.”
- Province of Ontario Debt Rating. The outlook on Ontario’s Aa2 long-term debt was revised to Negative from Stable. The revision reflects higher than anticipated deficit projections and ongoing fiscal challenges.
- Banco Espirito Santo. Move over Ronaldo. New to the international spotlight is Portugal’s second largest bank Banco Espirito Santo (translated as the Bank of the Holy Spirit). News that Portugal’s second largest bank is in financial dire straits roiled Europe’s’ peripheral bond and core equity markets. In need of divine intervention (Maradona’s Hand of God comes to mind) this latest episode reminds market participants how quickly complacency can turn into panic.
What should I be doing right now?
Canadian corporate bond spreads are at their historical average. They are well above their lows of 0.5% during the very loose monetary policy periods of 1984-88, 1994-98 and 2004-08 although we believe some of that differential is explained by the increased % of BBB credits in the indices.
We believe that the credit markets are slowly approaching another extreme in valuation. As illustrated in the charts on page 2 these extremes when reached can last for extended periods of time. We do not pretend to be able to call market tops (or bottoms for that matter) but are cognizant of the warning signs that warrant a more cautionary approach – cheap money, loose lending standards and overall complacency are three such signs. We also note that when corrections occur as markets “wake up” they are often violent and irrational and it is in those markets that the patient and well informed investor will prove their metal.
Canso’s valuation bias is now towards higher quality. Much of the value that is already embedded in our portfolio holdings will be realized with the passage of time. We will selectively add new positions when relative value dictates we do so and generally expect portfolio cash flows to be deployed into higher quality securities.
We remind our clients and ourselves that successful investing generates returns over long periods of time and through the extremes of economic and financial cycles. Patience and hard work are the investment virtues that underpin our portfolio management. We spend much of our time at Canso ensuring the consistency and continuity of our investment approach and ensuring we are prepared to capitalize on opportunities when they present themselves.
At the top of the cycle, it is hard not to become “stupid money”. It is in markets like the present that a valuation discipline is essential.