March Madness
With everything else going on who actually had time to watch college basketball this spring? (Hint Villanova won). World leaders were busy, putting pen to paper to ratify the Paris Climate Agreement, choosing up sides on Britain’s pending referendum on EU membership and secretly hoping for an OPEC deal at the Doha meeting. The whole world was stunned by the terrible terrorist tragedy in Brussels. The absurdity and theatrics of the US primary process and its participants provided moments of levity against a backdrop of “is this really happening?” No doubt Spring came in like a lion.
In the corporate world, Marriott International held out and bid up to acquire Starwood Hotels & Resorts Worldwide over a seemingly confused Anbang Insurance Group. The US Treasury put its foot down on so called tax-inversion deals, crushing the mega merger hopes of Pfizer Inc. and Allergan plc. MetLife, Inc. won a legal battle and will be hereafter classified as “systemically unimportant”. Who knew being average would make so many so happy as MetLife’s shareholders were when the stock rallied on the news.
Central Banks continued to pull out all the stops to prime the global economic machine. In January the Bank of Japan started charging banks for the privilege of stashing cash with them. The European Central Bank continued its assault on anemic European growth by pushing deposit rates further into negative territory and increasing monthly purchases on its asset purchase program to an eye popping €80 billion, now to include investment grade corporate debt. The Federal Reserve and the Bank of Canada steadied themselves, fought the urge to do something and held firm.
Let’s Go Crazy
After a demoralizing and head-scratching first six weeks of the year which saw financial markets plummet, they then proceeded to go on a nearly unprecedented tear. As quickly as markets fell they rebounded. Investors were quick to hop on the Valentine’s Day inspired rally as they worried about being left behind. Investors could not get enough and were bidding up every asset class in sight.
Corporate credit spreads widened significantly in January and early February, but by quarter end they were largely unchanged from the beginning of the year. Corporate’s higher yields drove outperformance versus Canada’s in all maturity segments.
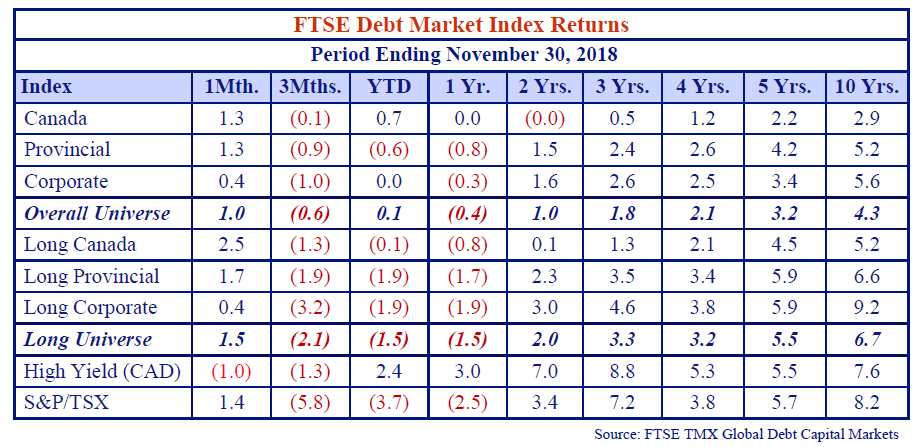
In the bond market Provincials narrowly topped Corporates with a 1.6% first quarter return versus 1.5% and Canadas a not so distant third at 1.2%. Long Corporates proved the best bond investment of all, generating a stellar 3.3% of return versus 2.3% for Long Provincials and 2.8% for Long Canadas. The US corporate market was the best performer of all at 3.9%. After a tough 2015, the commodity laden CAD and USD High Yield markets and S&P/TSX rebounded to returns of 0.9%, 3.3% and 4.5% respectively, although returns remain negative over the last twelve months for all three segments.
Sure As I’m Sittin’ Here
If in mid-February we told you everything was okay and financial markets had significantly overreacted, you might have looked at us as slightly insane. You would be forgiven for ascribing as much chance of markets staging a huge rally as you would have to Leicester City winning the Premier League; Danny Willett winning The Masters; Senator Duffy being acquitted on all charges; or Michael Strahan leaving Live with Kelly & Michael. Strange things do happen.
As it turns out everything was perceived as okay as markets staged an enormous and, as far as we could tell, unexpected rally. This reaffirms our belief that market timing is a dangerous if not a near impossible game. Our slow and steady approach dictates we buy securities we believe are undervalued. If securities become more undervalued and our Maximum Loss methodology allows, we add to our positions. It is a simple discipline that has added value over time. In markets that demonstrate time and time again they are irrational, this approach is much better than trying to pick tops and bottoms or chasing the latest investment fad.
What Goes Up Must Come Down
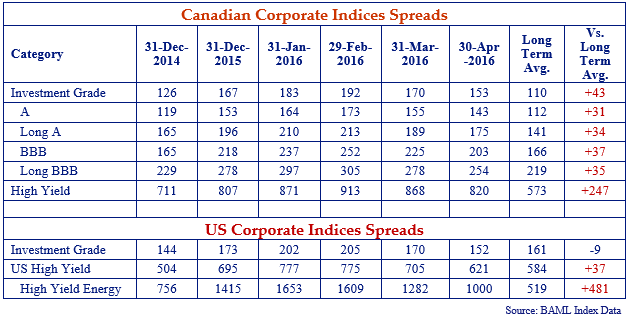
Part of the delay in publishing this edition of the Canso Newsletter is attributed to the rapid compression of credit spreads that occurred starting mid-February of this year – we just couldn’t keep up! To compensate we’ve added Bonus Coverage including spread data in the chart below to the end of April 2016.
Corporate spreads across all markets are substantially tighter since blowing out in January and February. According to BAML, US spreads tightened more than CAD spreads. US Investment Grade Spreads narrowed 53bps from the end of February to the end of April versus 39bps for Canadian Investment Grade. US High Yield narrowed 154bps versus 93bps for Canadian High Yield. US High Yield Energy narrowed 653bps from its end of January wide.
Put That In Your Instagram
Movements in Investment Grade Corporates don’t often cause sweaty palms or accelerated heart rates but they certainly did earlier this year. Why? Consider this. The average monthly spread change in CAD Investment Grade Corporates is 7bps and 13bps for US Investment Grade corporates (both of these are exaggerated by the extraordinary moves during the Credit Crisis). In February alone spreads widened 16bps in CAD and 29bps in the US followed by 22bps (CAD) and 35bps (US) of tightening in March.
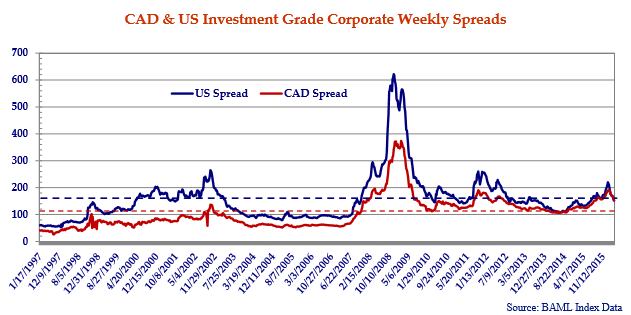
To further illustrate the magnitude of spread movements, the chart above presents weekly spread data (versus the monthly data presented in the table on the previous page). CAD Investment Grade spreads touched +190bps on February 19th, matching the wide level reached during the Euro debt crisis in the Fall of 2011. US Investment Grade spreads touched +220bps February 12th. As quickly as spreads moved out they snapped back to +153bps in CAD and +152bps in US as of April 29th.
Note at +153bps Investment Grade spreads in CAD are still well above the historic weekly average of +108bps. US Investment Grade spreads of +152bps are through their +158bps historic average.
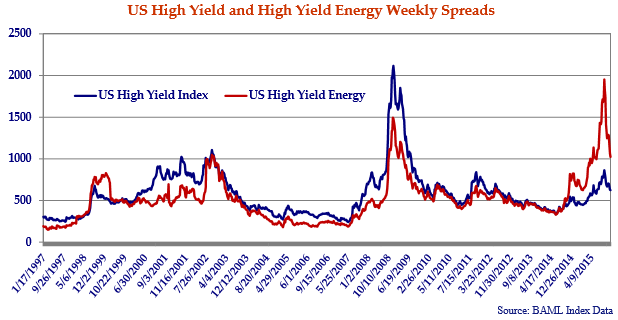
No sector experienced more volatility in the first four months of 2016 (and indeed over the last 12 months) than US High Yield Energy. We’ve pointed out historically HY Energy trades through the High Yield Index averaging +519bps versus +584bps going back to 1997. That all changed when WTI plummeted and wells ran dry – literally in 2015. The High Yield Energy Index hit +1953bps on February 12th and then rallied a remarkable 929bps to 1024bps on April 29th. Now that’s spread compression!
Still Crazy After All These Years
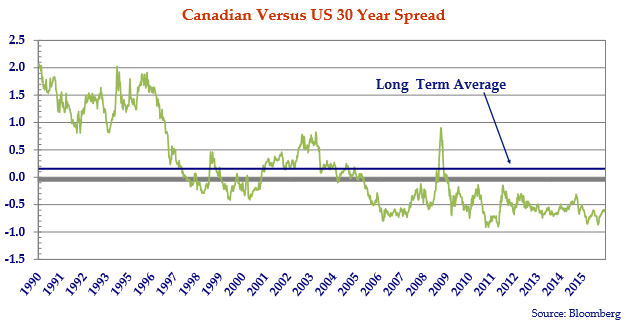
We continue to marvel at the Canadian interest rate situation particularly when compared to the US. We aren’t talking about Central Bank administered rates either. We are perplexed about rates out the curve which are determined by trade between seemingly expert professionals every day in the global capital markets.
As the chart above illustrates, for the better part of 10 years Government of Canada 30 year bonds have traded at lower yields than their US Treasury counterparts. We don’t dispute that at some point Canada was viewed as a safe haven in turbulent times but things do change. In our view the credit situation in Canada at the government (both federal and provincial) and individual levels dictates positive (not negative) spreads between Canadian government securities and US treasuries.
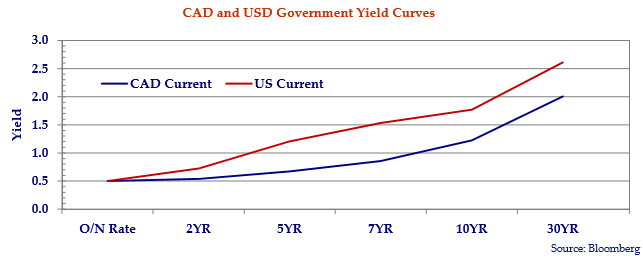
We maintain at some point the international community will come to this conclusion and Canadian rates will move to at least parity with the US or more than likely significantly higher. As the chart on the previous page shows, a move to parity implies Canadian non administered rates approximately 50bps higher than current levels. Such a move would result in significant losses particularly for longer duration portfolios.
Born in the U.S.A
In the first quarter the Federal Reserve maintained its intent to return monetary policy and yields to a ‘normal’ level by keeping the door open for further rate hikes during this year. The Fed also projected that inflation is expected to rise over the medium term to its two percent objective. Our rule of thumb on what constitutes a historical ‘normal level of yield’ is a function of inflation and the ‘real’ level of interest rates. Short term Treasury Bills should be about 2% above inflation and the yield curve premium for long bonds another 1-2% above this. With the central banks of the world targeting 2% inflation, this implies 4% T-Bills and 5-6% for long Treasuries.
We think that the Fed’s commitment to maintain loose monetary policy for the foreseeable future and err on the side of higher inflation makes for a long period of low short term interest rates. Since a steep yield curve is the most powerful economic portent we know of, this augers well for the US economy in the medium term. A steeper US yield curve combined with Canada’s weaker credit standing (reiterating the previous sections point) suggests Canadian non administered rates substantially higher than current levels.
Love Me Tender
We hope all of you have experienced the sheer magic of a Canso presentation at some point. For those who have you will undoubtedly recall one of the high points is our assertion that when we make an investment we are willing to hold that investment to maturity. Such was the case with a company called Depfa ACS Bank which issued, among other things, covered bonds to finance its lending business. Depfa falls into the weird and wonderful category of Canso investments – an Irish domiciled bank that through a series of missteps and one financial crisis ended up as, you guessed it, a ward of the German state.
As part of our bottom up fundamental review, we passed on these securities at new issue in 2005 because they were too expensive. We revisited the situation post Credit Crisis when we inherited Depfa bonds in a new portfolio and retained them. In early 2014, we reappraised these as AAA with a Maximum Loss of 1 based on, among other things, the explicit and implicit support from the German government. When a block became available, Canso purchased Depfa 2025 5.25% Covered bonds at par and Depfa 2035’s Covered bonds at $90 or spreads approximating +270bps.
In early February of 2016 Depfa tendered for these securities at spreads of +74bps and +98bps respectively translating to dollar prices of $126.82 on the ‘25’s and $127.11 on the ‘35’s. Suffice to say this generated a tidy return for our investors in a low risk investment.
On April 25th several GE Capital entities including GE Capital Canada Funding Company announced a series of tender offers for outstanding AUD, GPB and CAD securities. Canso agreed to tender its holdings at what we believe to be very attractive spreads.
As Depfa and GE illustrate, companies tender for bonds for different reasons. Depfa is slowly working towards its own extinction while GE is morphing into a leaner, possibly meaner corporate entity. In both cases retiring these securities made more sense than leaving them outstanding.
At Canso we analyze credit quality and assess relative value. We don’t try to predict or get in front of corporate actions be they mergers and acquisitions or bond tenders. We would have been happy to hold Depfa and GE to maturity but that said, sometimes when someone offers you a cigar and glass of premium scotch the best advice is to take it and Uber home.
Hey! Aren’t You Forgetting Something?
Just as one cannot predict tender offers, one can’t with 100% accuracy predict bond calls either. We were reminded of this in late March when our friends at the Royal Bank of Scotland decided not to call the CAD 5.37% May 12, 2016 Fixed / Perpetual floaters. So effective May 12th this bond will become a floating rate perpetual security paying CDOR +148bps. The floating rate bond will be callable on each quarterly interest payment date at par.
Also in April, Great West Life Insurance opted not to call US$300 million 7.153% May 16, 2016 Fixed / Perpetual floaters. So effective May 16 these securities will become floating rate notes paying Libor +253bps. The market is left to wonder about the billions of other securities issued as fixed / floaters.
There was a time when the term fixed floater was just a euphemism for a fixed rate bond. Issuers never contemplated not redeeming at the end of the fixed rate period and investors never dreamed they might actually get stuck with a floating rate security. Life was predictable and life was good.
With more and more frequency, issuers are finding the floating rate feature attractive and are choosing to leave these securities outstanding. There are many inputs into these decisions – including regulatory scrutiny, funding mix and pricing, capital requirements and rating agency treatment, to name just a few. Uninformed investors who purchased a fixed rate bond now find themselves in a bind. Note to market; if you are going to sell an option to someone you need to make sure you get paid for it.
We don’t own the Great West Life fixed floater. In the case of Canso and RBS, two key points need to be made. First, we grow more and more comfortable with RBS the credit as each month and quarter passes. As we’ve discussed at length in past Newsletters, in a low interest rate environment we view floating rate securities as an excellent bulwark against rising interest rates. We are happy to hold RBS floating rate notes.
Let Me Tell You the Story of Another Loser
Following in the footsteps of those great Canadian aggregators that have gone before, Valeant Pharmaceuticals finally came unravelled in late 2015 and early 2016. After years as a stock market darling, the company finally copped to some unsavory tactics and accounting chicanery in early 2016. Investors ran for the hills. Valeant has, among other things, replaced its CEO and much of its Board, been called to account by the SEC and Congress and seen its share price plummet. As troubled souls go Valeant is right up there.
According to Valeant’s overdue and just filed 10-K at December 31st, total debt at the company was a remarkable US $31 billion. For those keeping track that is nearly four times the size of the entire Canadian dollar high yield market – and that’s just one company! Valeant comprises about 2.3% of the entire US High Yield market.
Goodwill and Intangibles (that is those things you can’t touch and tend to be worth a lot less when you are forced to sell) summed a weighty US $41.6 billion or 85% of Valeant’s total assets at December 31st. A charitable estimate of Valeant’s annual EBITDA is $4.8 billion (before any numerous adjustments and charges) generating a Debt to EBITDA ratio of 6.4x.
We are surprised Valeant’s debt financed acquisition binge and questionable revenue boosting tactics fooled many investors for as long as they did. Proof again the financial markets are inefficient. A business plan built on aggressive acquisitions, leverage and accounting, and propelled by management ego can only sustain itself for so long before it unravels.
While the end game for Valeant is not certain, the company’s recent performance isn’t doing much for Canada’s reputation in the global capital markets. Valeant joins those other great Canadian success stories who flew too close to the sun including Laidlaw Inc., The Loewen Group, Inc. and Nortel Networks Corporation.
I’m Much Too Young To Feel This Damn Old
Maybe it’s the lousy Spring weather, the Blue Jays poor early season play or CNN’s fixation with Donald Trump, but we admit to feeling a bit grumpy these days. That said things could always be worse.
According to an article from the March 23rd Financial Times, it appears to be worse for Bob Goldfarb. Until recently Mr. Goldfarb managed the Sequoia Fund which had invested 30% of its assets in one stock – Valeant Pharmaceuticals. Talk about betting the farm. To top it off Sequoia Fund is a mutual fund, not even a hedge fund. The end result was the exit of the senior portfolio manager, Mr. Goldfarb, and a move to an investment approach seemingly a lot like Canso’s. According to the FT:
“The Sequoia Fund, the $5.6bn mutual fund with historic ties to Warren Buffett, said on Wednesday that Bob Goldfarb, its manager for the past 36 years, would retire following huge losses on its investment in Valeant Pharmaceuticals.
At one point last year, Valeant accounted for 30 per cent of the fund and managers purchased more stock in October after accounting revelations first knocked Valeant shares lower.
We have resolved to take a more collaborative approach to constructing the portfolio that will feature a more significant role for our senior analysts.” Source: Financial Times, March 23rd, 2016
At Canso we have always taken a collaborative approach to constructing portfolios. All of our investment staff have significant roles in the analytical process. Our Maximum Loss discipline ensures against betting the farm while not diversifying away the return potential of our top investment ideas.
Times They Are A Changin’
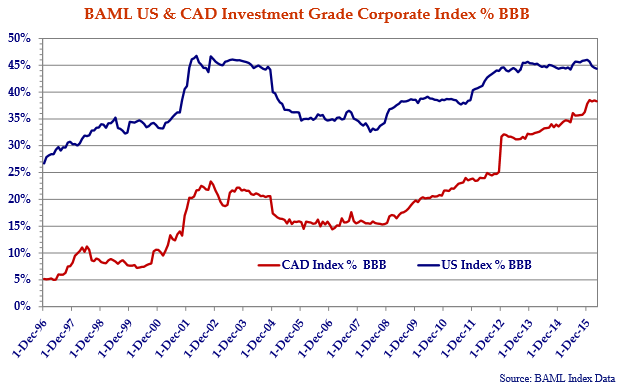
We thought we would revisit the credit composition of the Canadian corporate bond market. The shift in credit quality in the Canadian and US markets is highlighted in the chart below. Although the US started at a much higher level of BBB exposure, the formerly staid Canadian corporate bond market has made up much of the difference.
BBB rated issues accounted for 38.3% of the corporate market in Canada at April 30th against 43.9% of the US corporate market. The gap between CAD and the US has been steadily closing from 21.5% in December 1996, to 12% in June 2014 when we first presented this chart, to a scant 5.3% today.
Investors who have been loath to include BBB rated corporates in their portfolios might have been forgiven in December 1996 when BBB’s comprised 5.2% of the market, or even in December 2008 at 15.6%, but no longer. With nearly 40% of the market rated BBB this segment of the market is too large to ignore.
Baby, Everything Is Alright
The US economy is demonstrating strong job gains and improving household spending. The drop in commodity prices since last year and a strengthening US dollar may dampen growth in the short term, but is beneficial for consumers and businesses in the long term. The economic outlook has been improving in Europe, albeit slowly, with the weak Euro enabling a nascent recovery. We remain concerned about consumer debt levels and stretched housing prices in Canada. Canadian households are vulnerable to a sharp rise in interest rates and an increase in unemployment.
We continue to be concerned about duration risk in a low yield environment. We favour investment grade floating rate notes, longer duration BBB corporates, and as always unique undervalued special situations.
At Canso our collective experience tells us more often than not markets, people and institutions overreact. They are too euphoric on the upside and too manic on the downside. They zig when they should zag, stand still when they should jump and talk when silence is required. These tendencies tend to exacerbate financial market moves. At no time was this more evident than in the first four months of 2016.
At Canso conviction is high and turnover is low. If that seems a bit old fashioned in a world of Algorithmic trading and 24 hour Talking Head channels that is okay with us. We know if we have done our work properly we will generate positive long term returns for our investors.
