Mission Accomplished
Like George W. Bush standing on the deck of the USS Abraham Lincoln in May 2003, the market appears to have hoisted the “Mission Accomplished” banner on this monetary tightening cycle. Risk premiums have dropped, borrowers have renewed access to capital and the percentage of economists predicting a recession has dropped considerably from the “100%” tally of not so many months ago. President Bush gave his now infamous address only six weeks following the initial U.S.-led invasion of Iraq. We know now with hindsight that U.S. troops would go on to stay in the country for the better part of the next decade. For those keeping score at home, mark us in the “too early to tell” category on whether a “Soft Landing” has been achieved.
Total Eclipse of the Heart
We began April with impressive performances from both Caitlin Clark and the moon, but it is the markets that have truly been “shooting the lights out”. The bulls are on the run, advancing the S&P 500 Index above 5,000 to start the year up 10%. The price of gold and the price of Bitcoin both touched all-time highs while oil rose 16%. Facebook owner Meta Platforms introduced the company’s first dividend as the stock continues to rise off its 2022 lows.
While the market celebrates inflation coming down in North America, in Japan they are celebrating its return. The Bank of Japan increased their policy rate above 0% in March, ending an era of negative interest rates that began in 2016. This marks the BOJ’s first interest rate increase since before the Great Financial Crisis yet continues an accommodative stance to support inflation expectations moving forward. The Tokyo Stock Price Index (“TOPIX”) is up 16% year-to-date and after 34 years is within 5% of its December 1989 high.
Turn Around
The current optimism in the market is well reflected in the level of primary issuance. The issuance window has undoubtedly reopened for speculative-grade high yield bonds and levered loans, while higher quality investment grade issuance set a Q1 record. US$514 billion of investment grade bonds priced in the U.S. during the first three months of the year, up 34% over 2023 levels. New issuance was led by a series of “jumbo deals” from AbbVie (rated A-), Cisco Systems (rated AA-) and Bristol-Myers Squibb (rated A) who each raised over US$10+ billion.
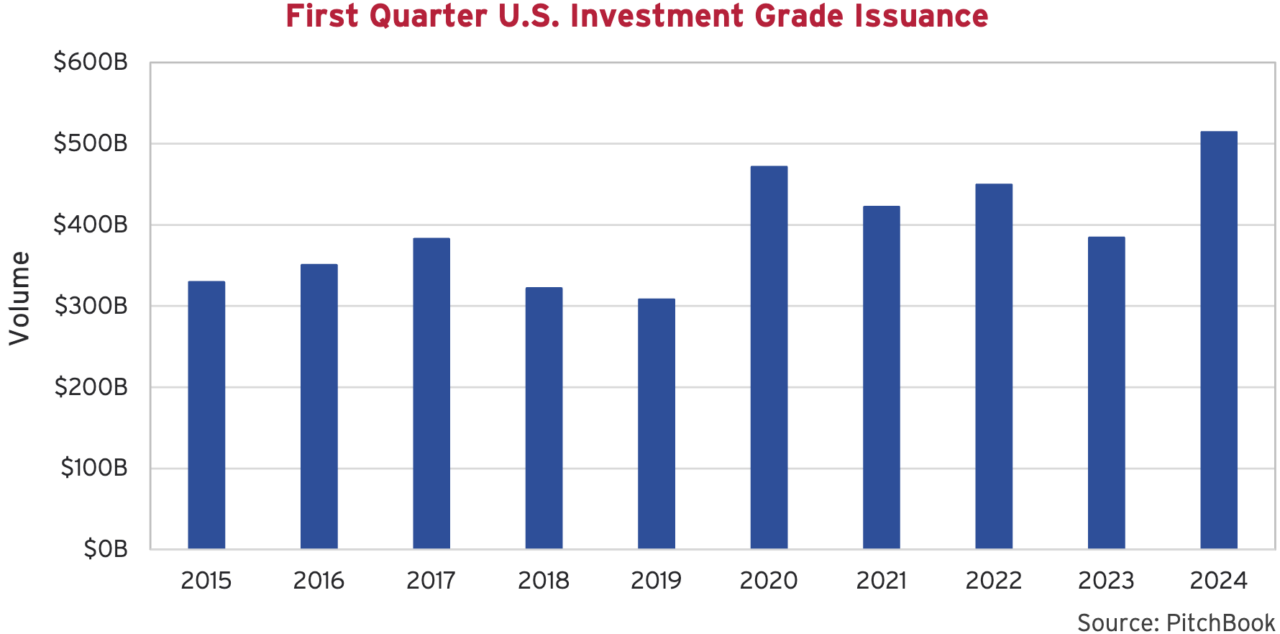
First quarter activity was further highlighted by a record setting 10-year offering from AA- rated Procter & Gamble. The owner of Tide, Crest, Gillette and many other household staples printed a 10-year senior unsecured bond at a credit spread of 37 basis points (bps) above Treasuries. This represents the tightest 10-year corporate spread on record, beating Johnson & Johnson’s 2013 issue which priced at 38 bps above Treasuries.
Over $40 billion of corporate bonds were sold in Canada in the first quarter, unsurprisingly led by the Canadian banks. The Canadian tally is also well above last year’s pace, as in addition to banks, true corporates have come back to the table. Tight corporate spreads and favourable credit conditions allowed issuers to come to market on attractive terms. We also had several borrowers tap the high yield market as SNC-Lavalin addressed upcoming maturities, Cineplex completed a comprehensive refinancing and Cogeco Communications issued unsecured bonds rather than their normal issuance of secured bonds.
Bright Eyes
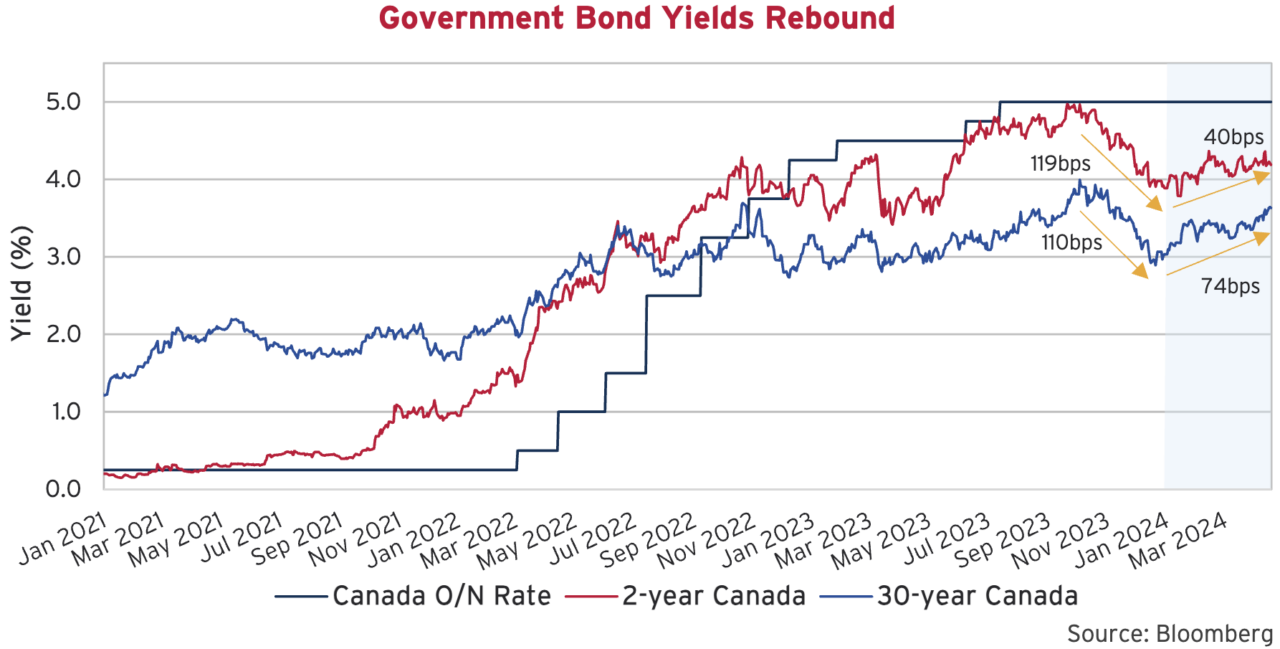
The sharp decline in government bond yields late last year drove significant absolute returns in high quality bonds. So far this year, government bond yields have rebounded higher. The yield on 2-year Government of Canada bonds is 0.3% higher and, out the curve, the 30-year is 0.6% higher. Once again, the bond market consensus has recalibrated its expectations on the timing and magnitude of central bank action. At its peak late last year, markets had priced in six rate cuts in Canada, while the sentiment has shifted back this year with yields now implying only two and a half cuts. The Bank of Canada has just announced that they are holding their policy rate steady at 5% for a sixth consecutive meeting and continue to signal that they are getting closer to rate cuts but need to see that the “downward momentum (in inflation) is sustained.”
The Bottom Line
While equity markets continue to soar to new records, high quality bond markets gave back some of the strong performance from the fourth quarter. Higher government bond yields across the curve meant that longer term bonds felt the largest price impact, due to their longer term and duration. As a result, the Canadian Broad Bond Index fell the most, while the relatively shorter duration U.S. Broad Bond Index wasn’t far behind. Investment grade corporate bonds were somewhat insulated by gains from tightening credit spreads and finished the first quarter around even.
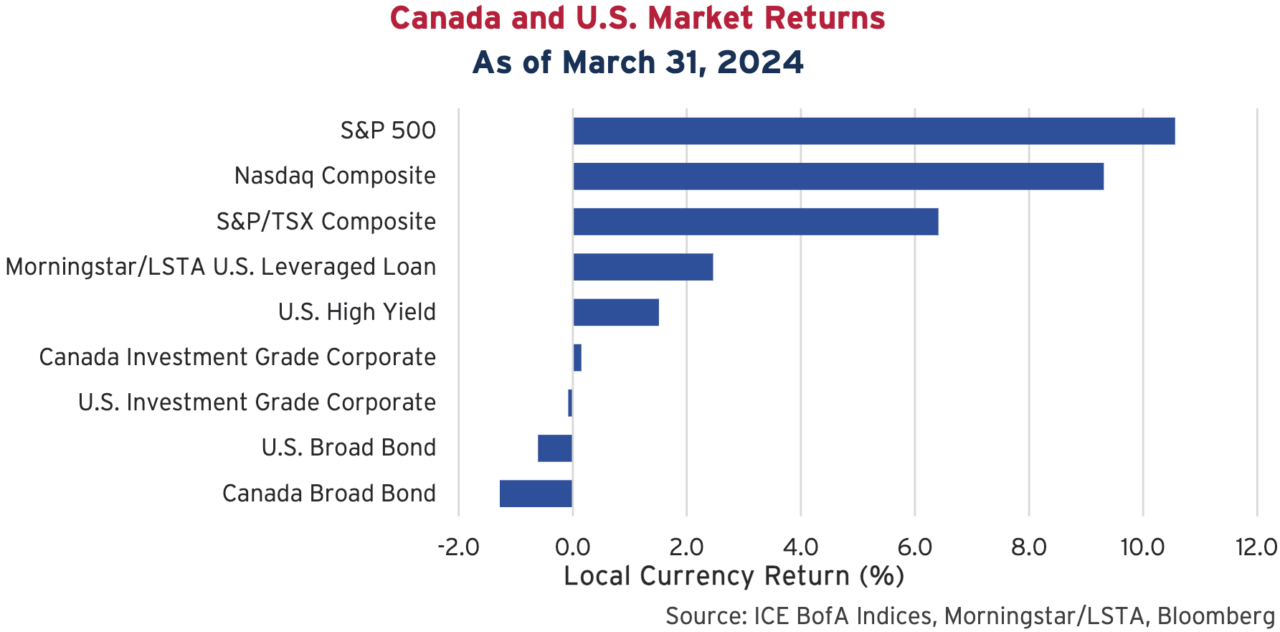
High yield bonds performed well, as their shorter term helped to protect them from higher yields and they benefitted from a persistent appetite for risk that pushed their spreads tighter. The floating rate Leveraged Loan market rallied alongside expectations for less easing and a resurgence in CLO origination. Issuers in both markets rushed to refinance upcoming maturities but there was limited net new supply from issuance to feed the demand.
Corporate Action
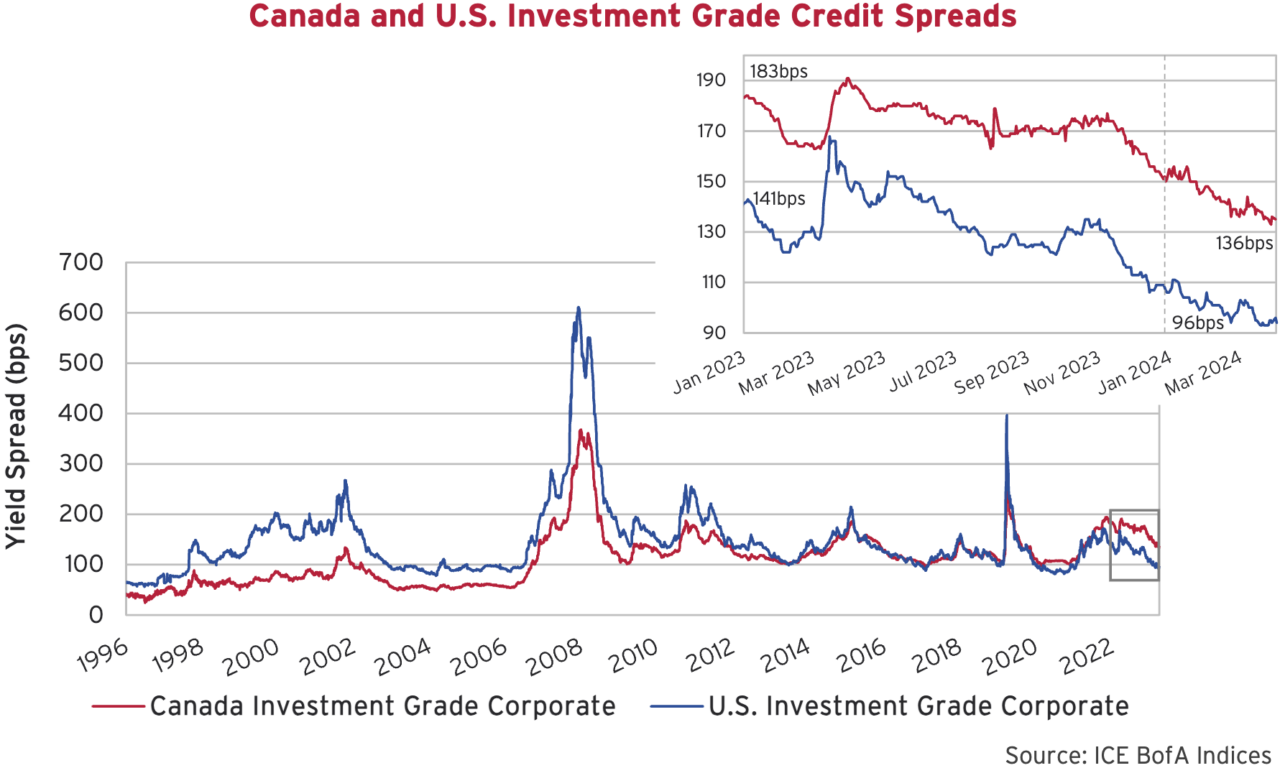
Investment grade credit spreads carried their momentum and have continued to tighten this year. This is a strong result given the magnitude of new issuance that has been absorbed into the market. Over the quarter, Canadian spreads tightened 15 bps while the U.S. tightened 10 bps. The Canadian market made a stride towards closing the gap with the U.S. but continues to trade materially wider.
As we have previously written, the recent differential in spread between Canada and the U.S. can be traced back to the relative underperformance of financials in Canada in 2022. This was a year in which the Big Six Canadian banks flooded the domestic market with more than double the new issue volume of the previous two years. So far this year, financials have performed well in Canada and are closing the gap with the rest of corporates.
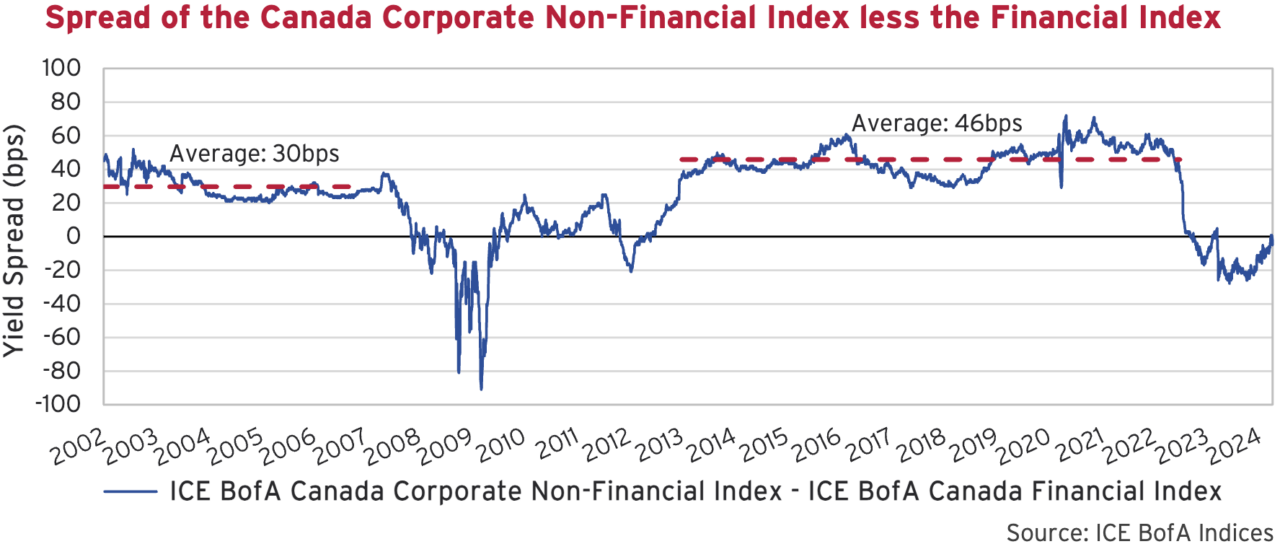
Although bank issuance today consists of bail-in notes versus deposit notes pre-2018, we still believe financials have further to go to move back to a more normalized relationship. Financials are normally lower yield spreads than other corporate bonds, as the chart below shows. Since inception of the corporate index, financials have only been higher during the Credit Crisis, the Euro Debt Crisis and then again beginning in 2022. Financial yield spreads are now trending back towards a more normal historical relationship, where they are normally 30-40 bps lower. They are now equal to non-financials and should move lower.
Ring of Fire
As investment grade credit spreads push tighter, the U.S. market is looking more and more expensive. If we look back to the historical context in the graph of market spreads above, this is clearly evident. The index in the U.S. finished the first quarter at 96 bps, which is well inside the series average of 146 bps. Current valuations are also close to previous cycle tights.
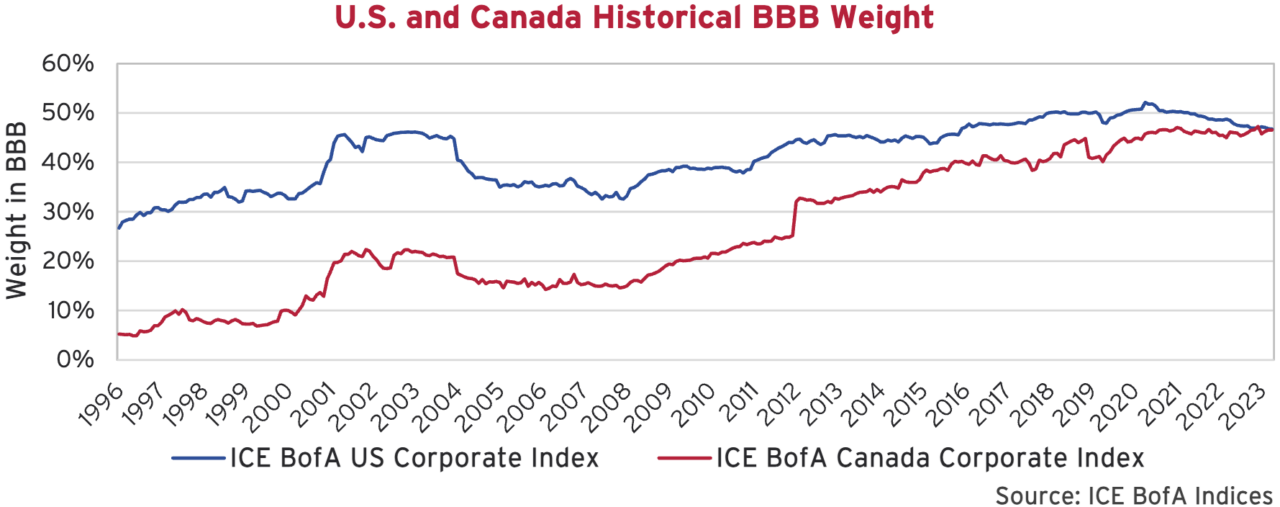
Canadian investment grade continues to look like better relative value. Despite the move tighter, there is still a ways to go to reach the tights of 2021 as well as valuations of other previous cycle peaks. At the end of the first quarter, the spread of the Canadian index was 136 bps, which looks reasonable in historical context. Historically though, the Canadian market has been much higher in credit quality. The graph below plots the historical weight in BBB since inception of both the Canadian and U.S. Investment Grade Indices. Bonds rated BBB represented only 10% of the Canadian corporate market in 2000, but the steady increase in Canada finally collided with the U.S. this quarter, representing 47% of the corporate market. With more BBB, we should expect that Canada would be somewhat wider than other cycle tights.
Risky Business
High yield credit also carried its strength into the first quarter of 2024. Credit spreads continued to march in, finishing the quarter 29 bps tighter. While credit spreads have moved tighter this year, the yield of the high yield market has remained steady. A bounce back in government bond yields has propped up the yield and masked reduced compensation for credit risk. We worry that the lower compensation for credit risk is not fully appreciated by high yield investors.
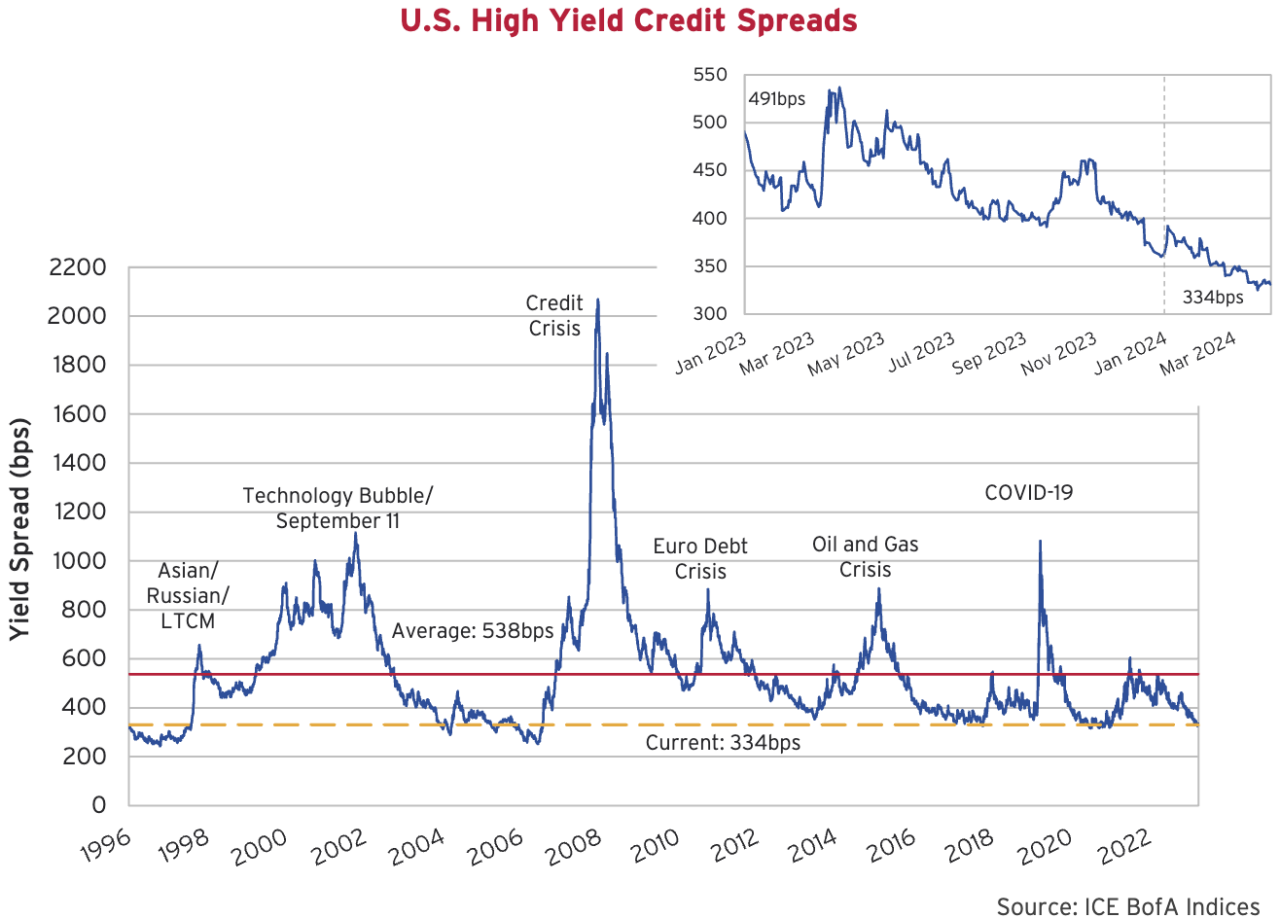
High yield spreads finished the period at 334 bps, which continues to offer insufficient compensation for underlying credit risk. From the graph above, we observe spreads that are well inside the index average and are retracing previous cycle tights. Based on historical precedent, we believe there is little upside for most high yield credit beyond its running yield. At current valuations, it is important for investors to be discriminate and understand the credit risk they are assuming. At this point in the cycle, that never seems to be the case.
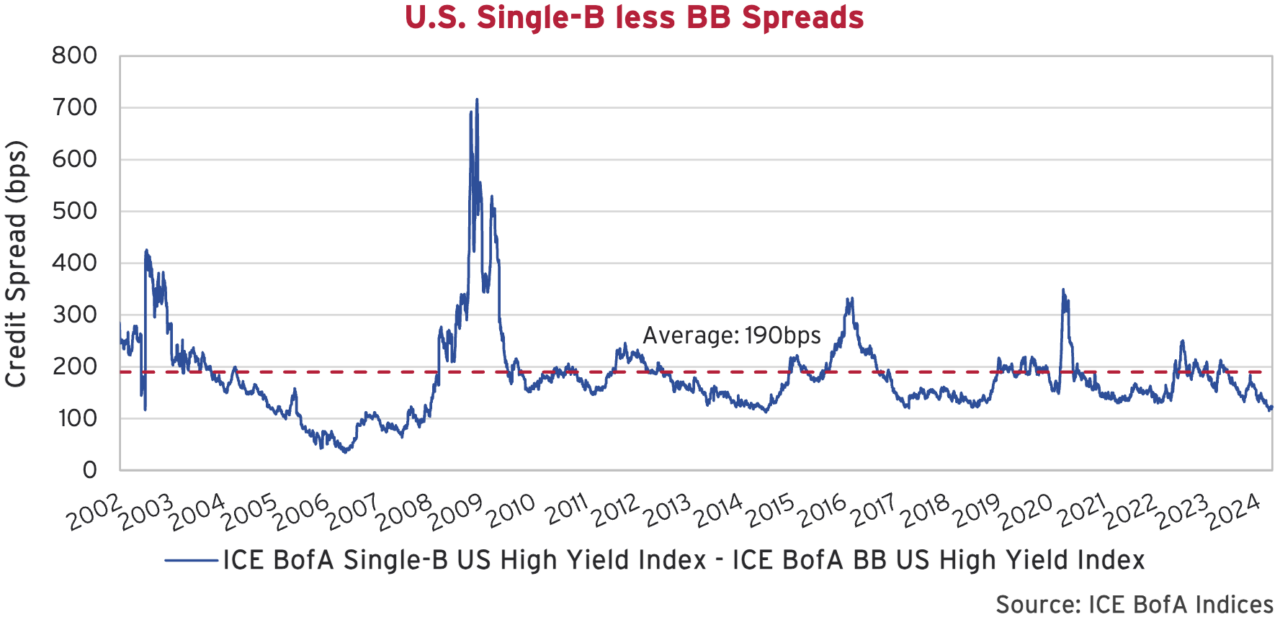
So far this year, B-rated bonds have outperformed higher quality BB bonds. Below we have plotted the difference in credit spread between the two. A renewed appetite for risk has reduced the basis to 123 bps, which is well inside of the series average, and again, retracing previous cycle tights.
Dancing In The Dark
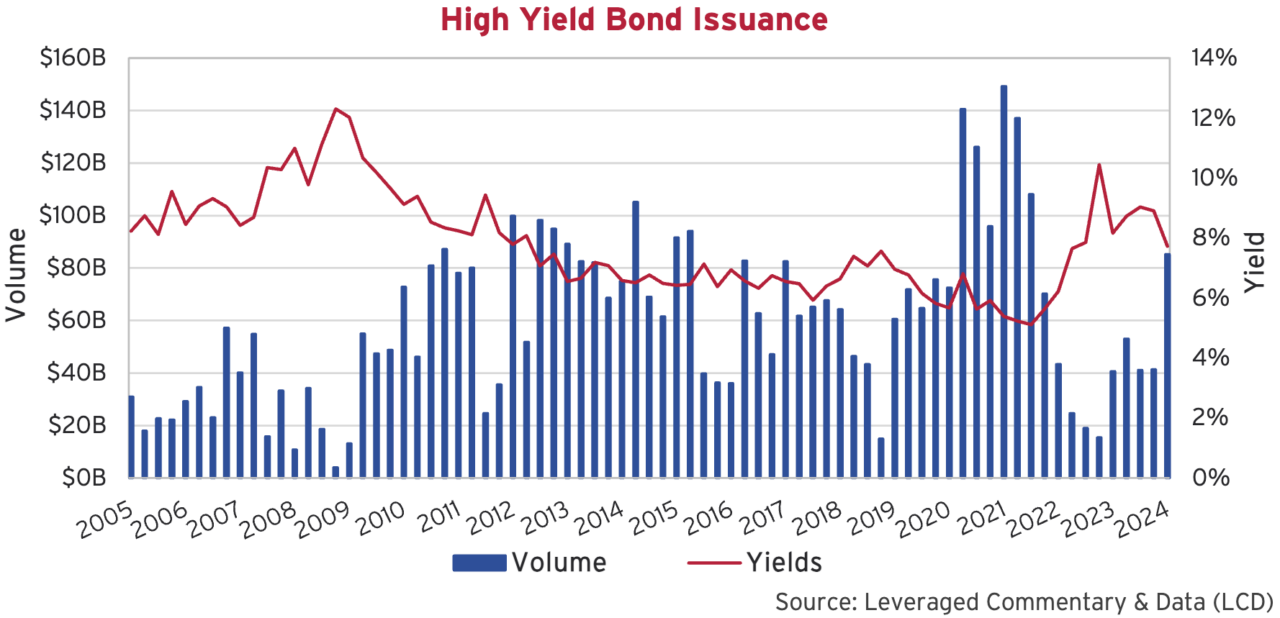
This year we have seen the highest quarterly volume of high yield new issues since 2021. At that time, companies rushed to lock-in historically low borrowing costs while they could. Surging yields and tighter borrowing conditions would then grind primary markets to a halt. With issuers flush with cash, many were happy to wait for things to improve. The average yield on new issues has since come down from over 10% at the end of 2022, to just under 8% at the end of March.
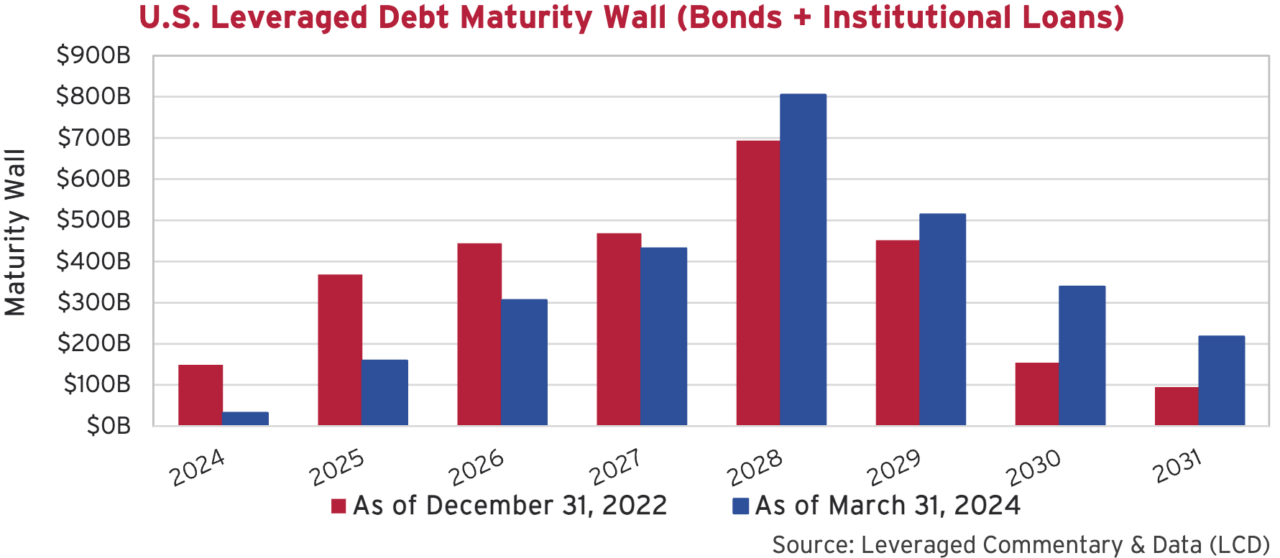
Refinancing activity surged in the first quarter, accounting for over 82% of high yield issuance, according to JP Morgan. The timing has lined up nicely for issuers needing to address looming maturities after two years of muted issuance. When new issue volumes dropped 80% in 2022, many investors began questioning the impending “maturity wall”. We can see from the graph below that many of these concerns have been allayed. On December 31, 2022, cumulatively there was US$517 billion of high yield bonds and levered loans needing to be refinanced or paid down in 2024 and 2025. Fast forward to March 31, 2024, and with renewed activity that number has reduced to a much more manageable US$191 billion.
Cruise Control
To illustrate the turn of the tide, we look to a recent high yield bond issued by BB- rated Royal Caribbean Cruises. Royal Caribbean came to the market in February 2024 with an 8-year senior unsecured offering. The bonds priced at par with a 6.25% coupon, representing a credit spread of 192 bps above Treasuries. A modest premium for notably more risk, in our view.
As a cruise operator, Royal Caribbean was in one of the worst affected industries during the pandemic. In May 2020, the pandemic nadir, the former investment grade company was forced to come to the market at an inopportune time. As a result, the company issued two first-lien secured bonds at a discount to par with coupons of 10.875% and 11.5% or credit spreads of 1,147 bps and 1,197 bps. These 2 bonds have since been called, but are brought up to highlight just how cyclical the bond market can be. Royal Caribbean went from borrowing at a 12% risk premium on a secured basis, to a 2% risk premium on an unsecured basis in a little under 4 years. Timing is everything.
Privately Defined
The investment industry is a marketing machine. It is filled with buzzwords, acronyms, acute segmentation and false sophistications. At Canso, we try to keep things simple and resist narrowly defined mandates. At the end of the day, there are borrowers and lenders. Borrowers don’t care if you call your fund private credit, public credit, investment grade, high yield, junior debt, senior debt, bond king, loan queen, fixed star or floating moon. Borrowers will look to raise the cheapest financing on the most attractive terms. End of story.
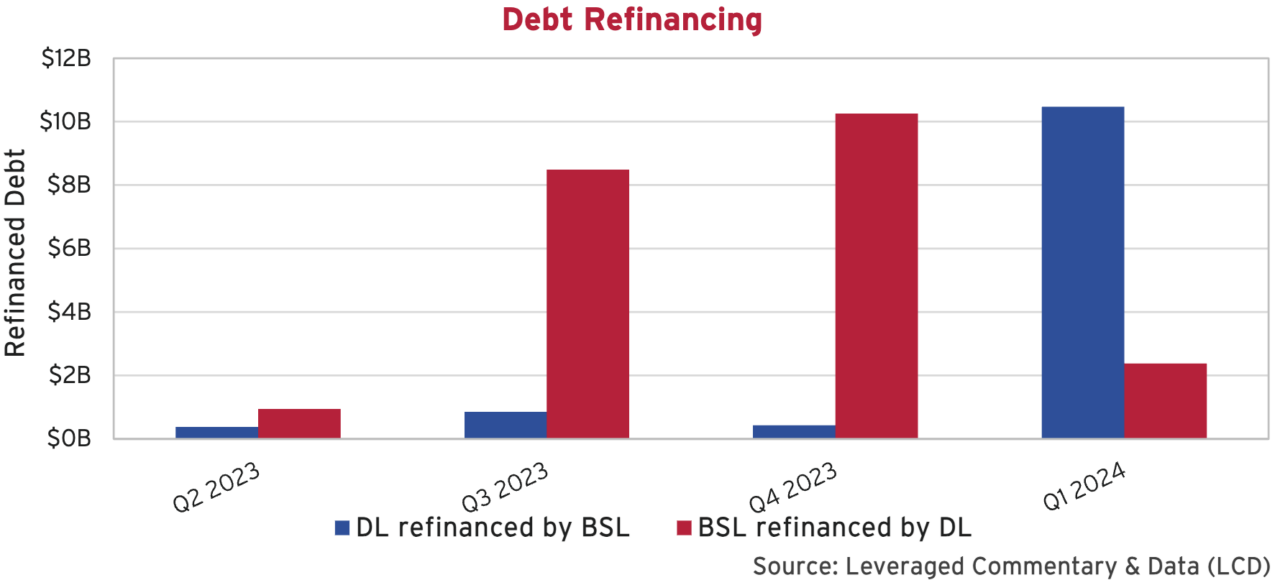
The rise of private credit has grabbed the attention of the investing industry over the past several years. Yes, there can be idiosyncratic features and attractive characteristics given certain market conditions, but market conditions vary over time. Private credit (also referred to as Direct Lending or DL) competes with levered loans (also referred to as Broadly Syndicated Loans or BSL) and high yield bonds. If the BSL market recedes and these lenders get cautious, borrowers will rightfully seek out the DL market. When life comes back to the BSL market, the pendulum swings the other direction. We can see very clearly from the graph below that the pendulum indeed has swung back to the public markets in the first quarter of 2024.
Blinded By the Light
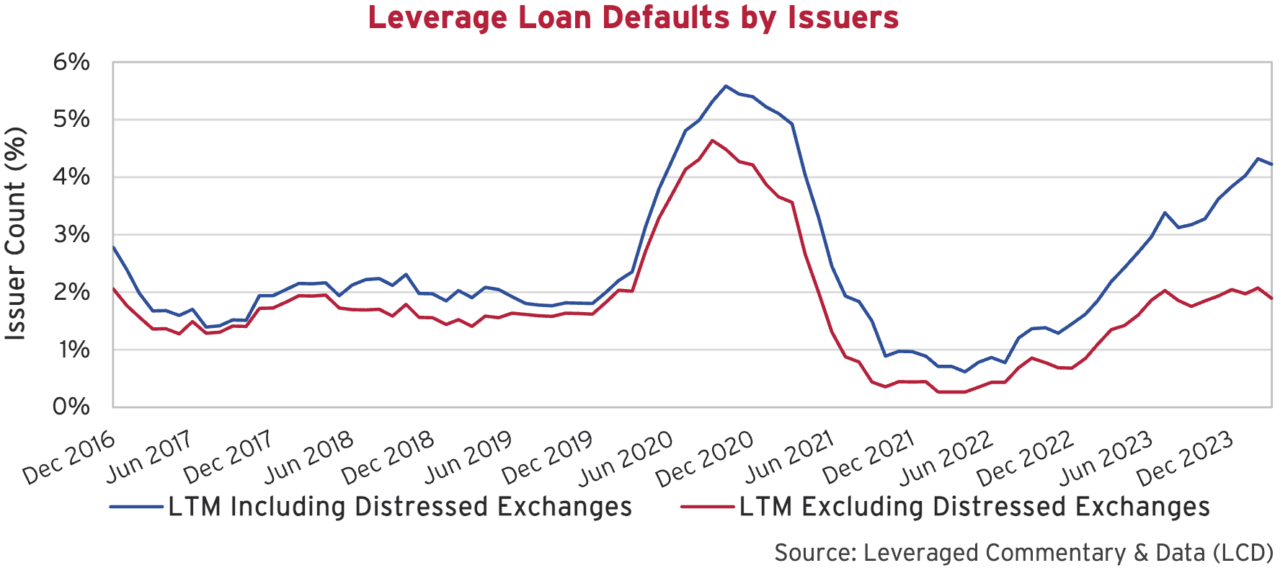
When observing the strength in the credit markets and tightening risk spreads, it is interesting to note that defaults have in fact been increasing. PitchBook LCD has released a new dataset that incorporates both payment defaults plus distressed exchanges. We can see from the graph below that payment defaults have risen modestly whereas distressed exchanges have increased at a much more meaningful rate.
“Distressed exchanges” can include a variety of creative transactions initiated by either borrowers or a subset of lenders. These transactions attempt to reduce a troubled company’s liabilities or bring fresh capital into a business. One of the hottest terms in finance at the moment is “Liability Management Transaction” or “LMT”. These transactions can take on a variety of forms but typically involve moving assets and collateral to different subsidiaries or introducing new ranking levels within a company’s capital structure – all with the goal of reducing the face value of existing obligations by coercively disadvantaging existing lenders. With LMTs on the rise, it is more important than ever for investors to roll up their sleeves and perform rigorous due diligence to understand the true risks in an investment.
Thinking, Fast and Slow
Daniel Kahneman, one of the early thought leaders on behavioural economics, passed away at the end of March. His book Thinking, Fast and Slow was published in 2011 and soon became part of the Canso investment syllabus. His focus on thought systems, heuristics and human bias are important reflections for any investment professional.
We believe that the appetite for risk in credit markets continues to dislocate from fundamentals. This is particularly true within the most speculative ends of credit, where risk premiums pushed tighter again this quarter. With valuations more and more stretched, our portfolios continue to migrate towards quality and liquidity while we scour the markets for special situations. We continue to believe that protecting capital, rather than reaching for yield, will win out once again.