Running on Empty
There is no way to sugarcoat it. The change came overnight. We went from ebullience on the economy and the financial markets to utter despair. Hundreds of thousands have died globally. Millions are sick and tens of millions are unemployed and struggling to feed their families. In the developed world, schools, stadiums and streets are empty. The sheer scale of the medical, social and economic carnage has numbed the senses.
As governments now relax COVID-19 restrictions, whether too slowly or too quickly, we believe it is time to take stock of what has happened. The financial market impact and movements since COVID-19 reared its ugly head in Wuhan in mid-January have been extreme in both directions. We’ve gone from a brutal selloff and cataclysmic value destruction during March to the financial market resurgence of April and May. The market cynics are disparaging the rally in “risk assets”, as is always the case in a bull market. Is the current price appreciation warranted? Well, as always, the proper answer is “it depends”.
Whatever it Takes
As the world grasped the health risk posed by COVID-19, panic created severe dislocations in financial markets. Fixed income markets diverged. Government bond yields plummeted as corporate bond risk premiums skyrocketed. Liquidity evaporated and even short-dated U.S. Treasury Bonds (UST) traded by appointment as traders ran for cover.
Central bank emergency interest rate reductions in March slowed the decline of financial markets in freefall. The expansive Federal Reserve Bank pumped massive liquidity into the U.S. credit markets. The Bank of Canada did its part to support the Canadian credit markets, albeit a bit slower, a lot later and with much less display of brute force.
Subsequent fiscal policy announcements by governments will be expensive but are very necessary medicine for economies in the midst of full cardiac arrest. Revenues literally disappeared for many companies and economic activity plunged, taking Gross Domestic Product and Income with it.
Liquidity quickly returned to higher quality credit markets as the Fed borrowed policy from the ECB, creating its own version of “Whatever it Takes” with a vengeance. Buying Exchange Traded Funds (ETFs) is a very novel form of experimental monetary policy, but this juiced the Investment Grade (IG) corporate bond market. Fearing the impact of leaving issuers out, the Fed programs extended to fallen angels downgraded below IG after the magic date of March 22nd. The Fed once again guaranteed money market mutual funds. These now seem to offer deposit insurance with no premiums paid.
This monetary policy tsunami was successful. The “Whatever” policies took hold and access to credit was restored. Higher quality corporations were able to use their credit lines and the new issue markets to build their cash reserves. Whether these actions averted economic disaster remains to be seen, but monetary and fiscal policy was created fast and furiously. Things moved so quickly on the policy front that the markets struggled to catch up. Once they had impounded the “policy upside”, it was up, up and away!
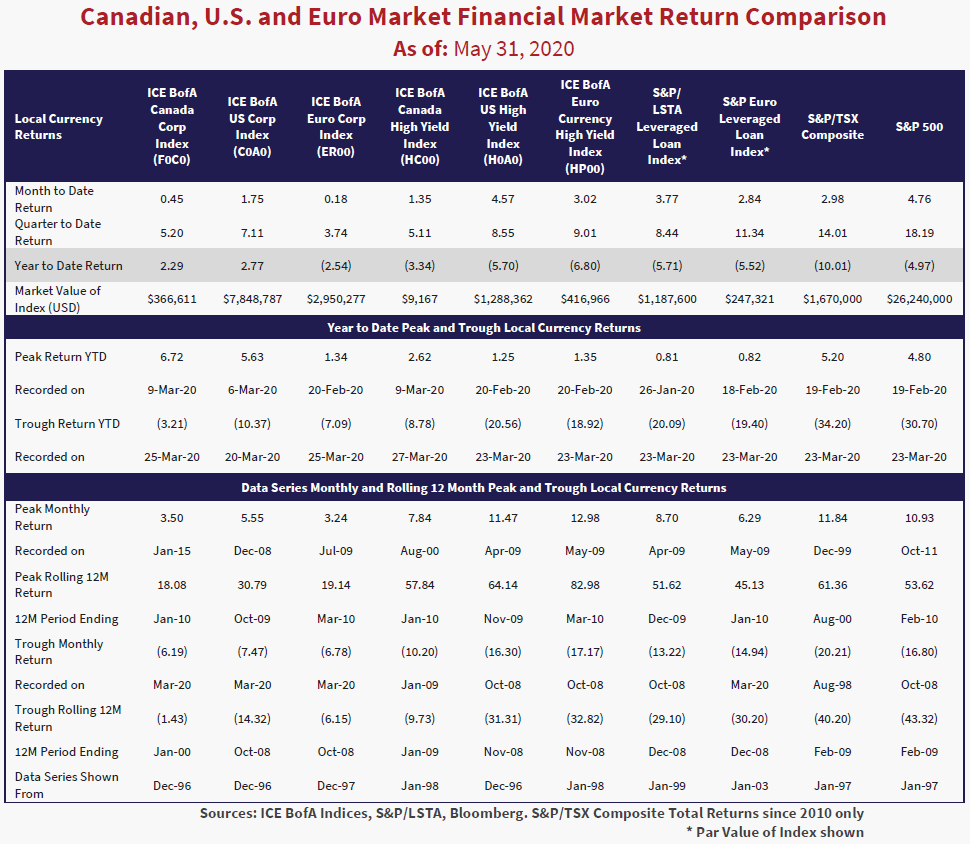
The table above highlights returns across major credit markets and the Canadian and U.S. equity markets. The U.S. IG market fell 16.0%, peak to trough. U.S. High Yield (HY) fell 21.8% and the S&P 500 fell 35.6% over the same period. Most markets hit bottom on March 23rd. Canadian credit markets froze up, with inactivity artificially arresting the decline. Canadian IG and HY fell only 9.9% and 11.4%, peak to trough, with the S&P TSX down 39.4%. Equity and credit markets then rebounded significantly from trough levels. Round and round and up and down, here we go again.
Remember When Things Were Really Humming?
Do you remember when things were really humming? It was not that long ago. February 2020 to be exact. Before COVID-19 became a household word, the Canadian and U.S. economies were expanding at a respectable 1.9% and 2.1% rate, unemployment stood at 5.7% and 3.5% and inflation percolated at 2.1% and 2.5%. Cheap money fueled speculation in credit, equities and real estate. Stock markets hit all-time highs on February 19th. Then all heck broke loose in the markets as COVID-19 went from “no worse than the common flu” to destroying the U.S., Canadian and global economies.
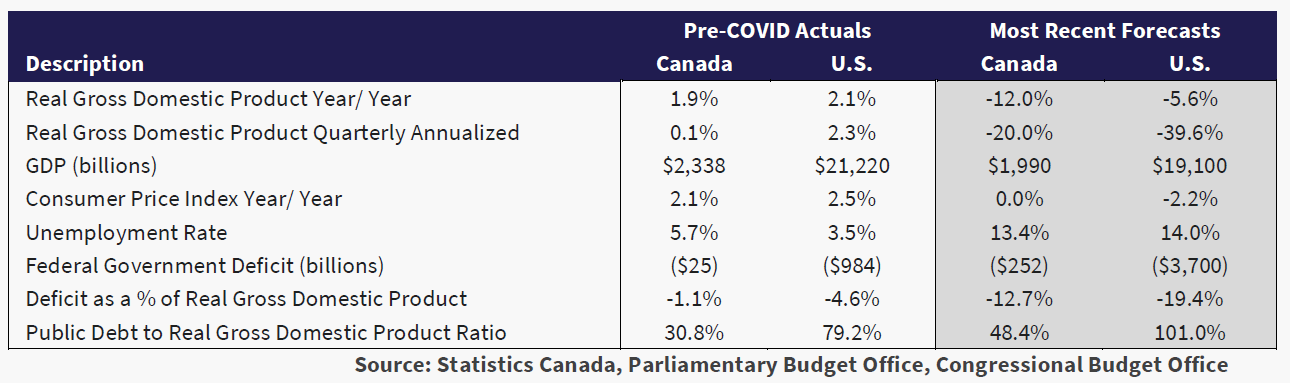
The Parliamentary Budget Office now projects the Canadian economy contracting at a -20% annual rate in Q2. For comparison, Canadian GDP contracted -3.2% in 1982, the previous worst reading on record. Canada’s forecast, although horrific, seems optimistic considering the Congressional Budget Office’s -39.6% estimate for the U.S. economy. Unemployment forecasts in both markets are ~14%. Debt and deficits are skyrocketing. At a time when few things are certain one thing is clear – the hangover from the short-term economic arrest coupled with untested economic fixes is unknown and could be long and painful.
Early in 2020, the ebullient equity markets buoyed the speculative credit markets. On February 19th, the S&P 500 peaked at 3,386 and HY spreads registered 370 basis points (bps). The 3.7% in yield spread above UST that a non-investment grade issuer paid to borrow money was well below the historical average of 5.5%.
The market tone soured as “shelter in place”, “social distancing” and home schooling replaced spring break, playoffs and graduation celebrations. On March 23rd, the S&P closed at 2,237, down 34%. HY spreads closed at 1,082 bps or a nearly 11% premium versus U.S. Treasuries. Central banks and public policy responses mitigated market panic and the markets began to retrace losses. The magnitude of the public policy response and resolve of the Federal Reserve steeled markets. At May 29th, high yield spreads closed 433 bps tighter and the S&P 500 jumped 807 points higher than on March 23rd.

Panicked Markets
What does panic look like in the fixed income markets? The chart above shows you that high yield spreads gapped higher as equity prices plunged. Investors bolted for the exits, selling whichever IG and HY corporate bonds they could to purchase USTs. This flight to quality drove UST yields lower, and corporate credit spreads much higher.
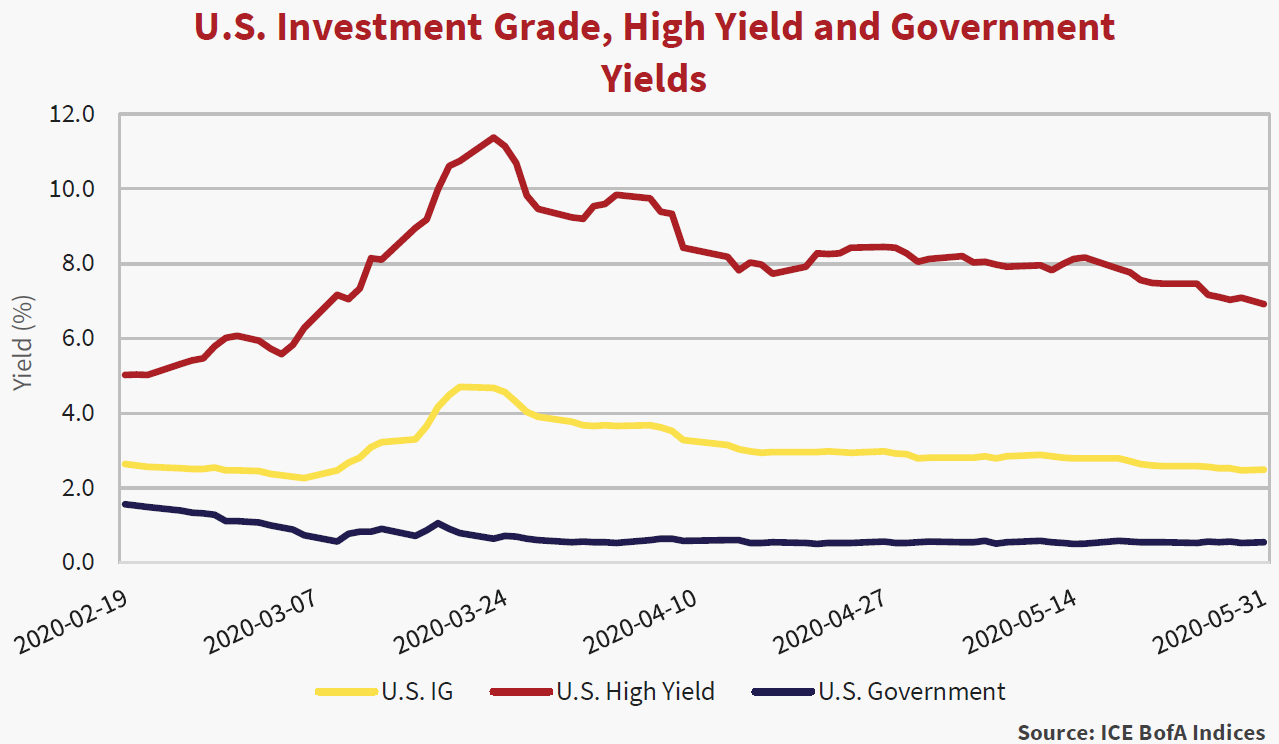
The graph above illustrates the impact of the flight to quality trade on yields of UST, IG and HY bonds. The blue line shows UST yields fell while the yellow line of IG and the red line of HY yields “gapped” higher. Rapidly falling government bond yields turned sovereign debt holders into reluctant heroes while leaving corporate bond investors savaged. The graph also highlights the enormous opportunity created by indiscriminate market selloffs. HY bonds yielding 5% in February yielded in excess of 11% a few weeks later. That was opportunity to a very few brave investors who had ready cash to spend.
Making It Work, Takes a Little Longer
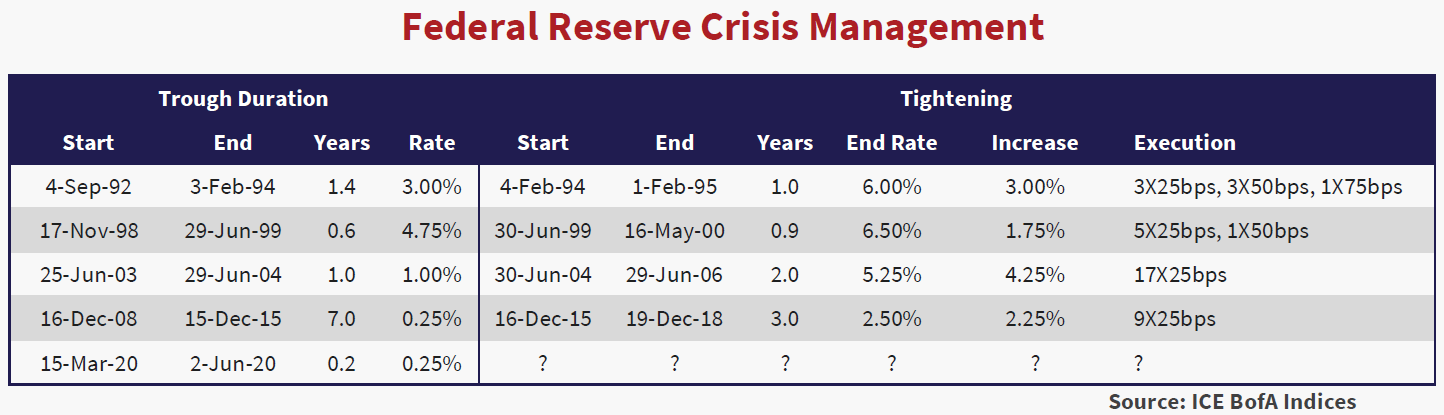
The Federal Reserve and Bank of Canada responded to the COVID-19 crisis with a series of emergency rate cuts. The Bank of Canada cut rates three times by 50 bps, while the Fed executed one 50 bps cut and then decided to go all in on March 15th with a follow up 100 bps reduction. By March 27th, the overnight rate in Canada and the United States sat at a rock bottom 25 bps.
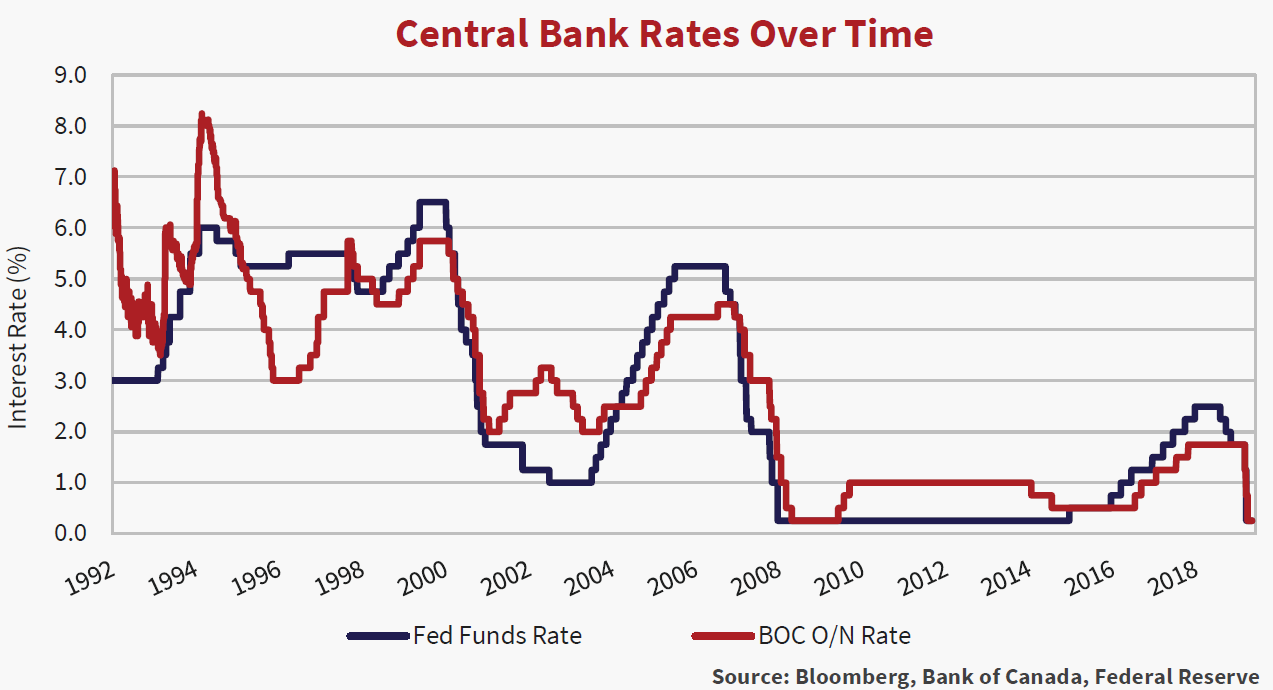
During the Credit Crisis, the Federal Reserve lowered overnight rates to 0.25% for the first time in its history. They stayed at that level for the next seven years. The Fed returned rates to that level this past March 15th. Given the severity of the economic disruption at hand – any guesses on how long rates stay at 0.25% this time around?
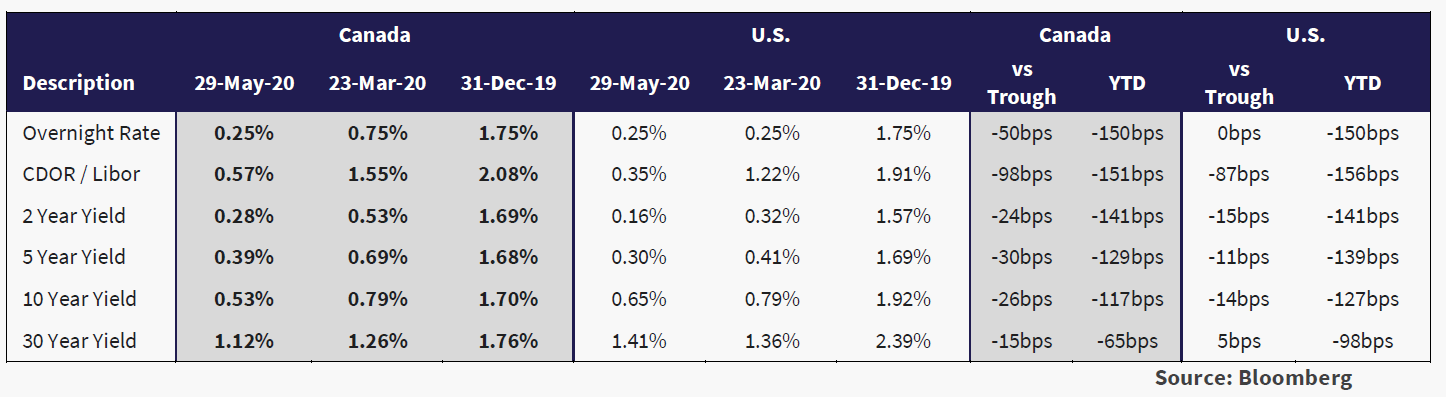
Lower Rates
Lower bond yields were the result. The table below highlights the dramatic lowering of interest rates in Canada and the United States year-to-date in 2020. Yields are much lower from overnight rates and out the yield curve.
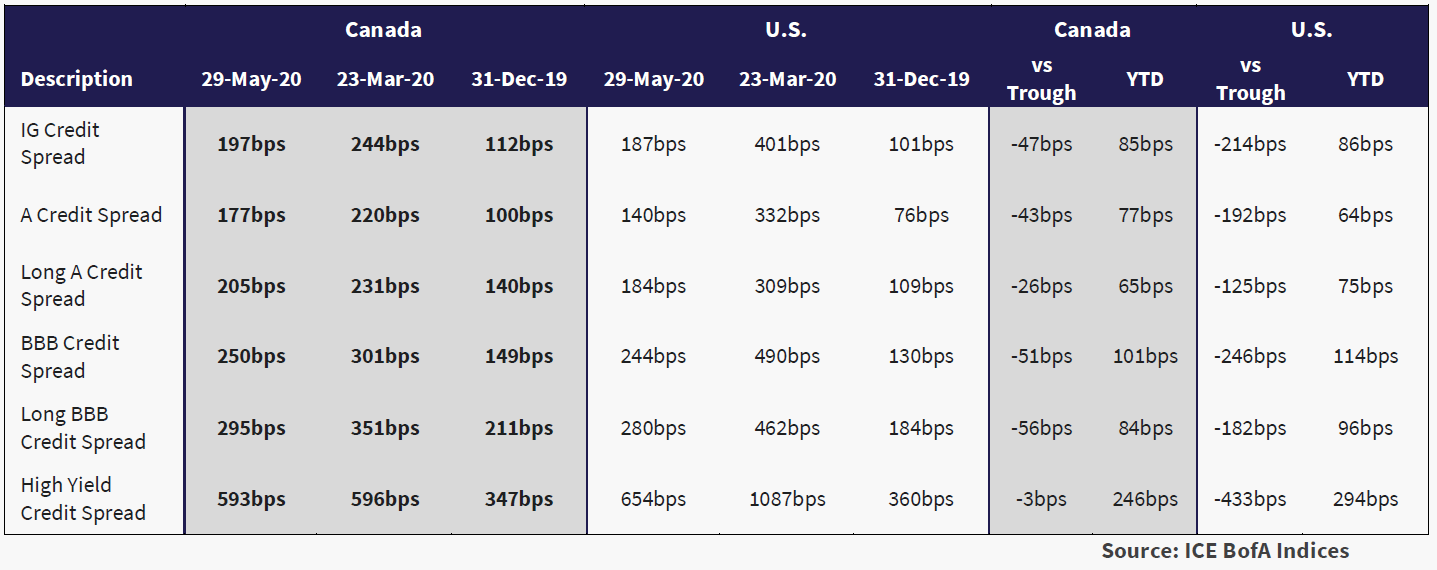
Higher Spreads
The table below highlights the dramatic widening in risk premiums and the partial retracement in Canada and the United States corporate bond markets.
Panicked Selling and Few Buyers
So, what happened to liquidity in the corporate bond markets as panic set in? As equity markets plummeted, investors liquidated riskier assets. These liquidations derived from a variety of market participants and were driven by varied motivations. These included retail investors panicked over “higher risk” holdings in bond ETFs and mutual funds, selling by prime brokers issuing margin calls to leveraged participants and rebalancing from fixed income to equities. There were also a very few market participants, including Canso, keen to take advantage of relative value trading opportunities.
“No Bid” for Short Corporate Bonds
In Canada, regardless of description and motivation, this resulted in investors converging on investment dealers to sell the their most liquid assets, short-dated, high quality bank covered bonds and deposit notes. Investment dealers’ capacity and willingness to buy bonds, including those issued by their parent companies, quickly waned as their inventories grew and then evaporated. This utilization of capacity is evidenced in the IIROC trading statistics for March showing nearly $15 billion in bond trades with investment dealers versus $3.3 billion on average in the 14 months prior. As inventories of bonds skyrocketed, investment dealers went “no-bid”. Liquidity for corporate bonds, even of the highest quality, vanished.
During the depths of the Credit Crisis in late 2008, the corporate bond traders at several Canadian bank-owned dealers refused to bid on their own banks’ deposit notes. The same situation occurred during the credit market sell off in mid-March when a major Canadian dealer refused to bid on its own parent’s AAA-rated covered bonds.
The Price Isn’t Right
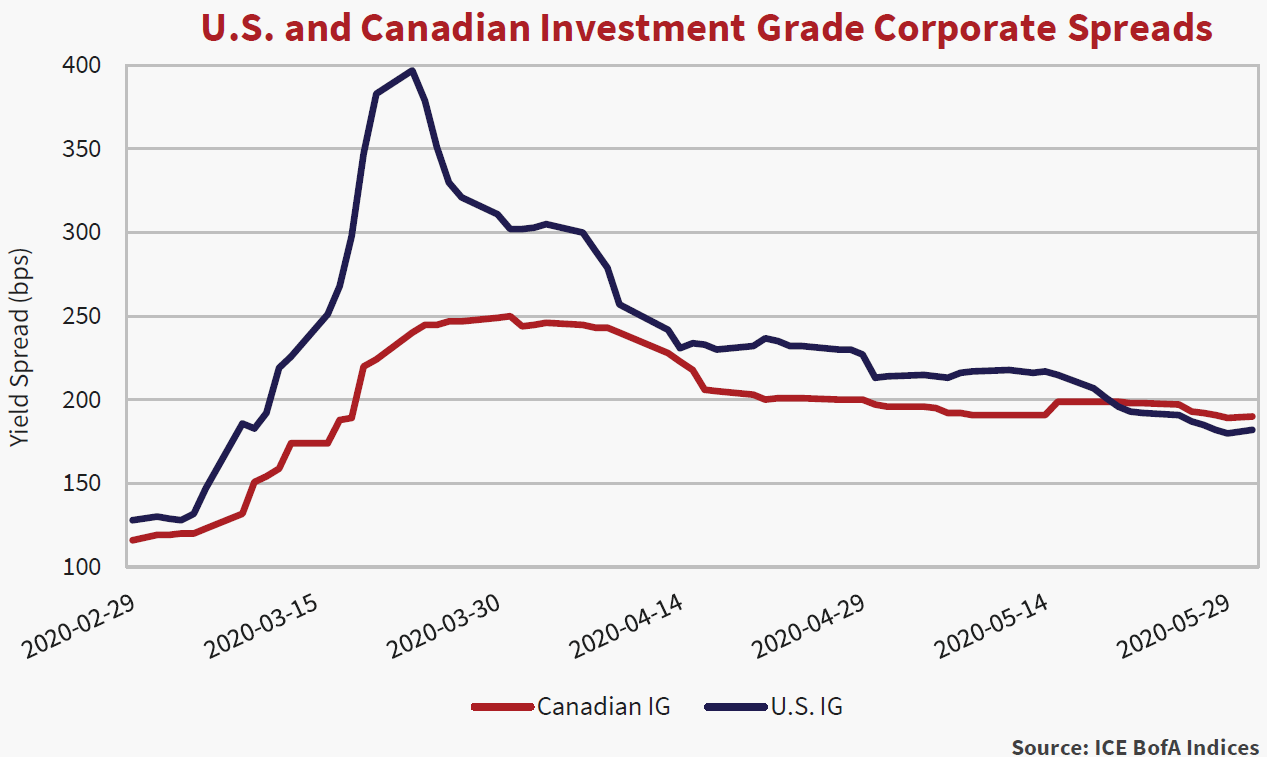
The graph below highlights the differential in spreads between the Canadian and U.S. investment grade corporate markets. The argument could be made that the lack of liquidity in the Canadian corporate bond market ended up damaging Canadian prices less, but the fact remains that this resulted from an inability to trade. Did this hurt anyone? Well, anyone buying or selling mutual fund units or ETFs containing only Canadian corporates did so at “fictional” prices and there were a lot of transactions in mutual funds and ETFs during this period. A seller got a much higher price for their units than warranted and a buyer overpaid substantially.
In the U.S., both the secondary and new issue markets remained largely open and functional, albeit with much lower volumes initially and much wider bid offer spreads. We believe the spreads of U.S. investment grade bonds in the graph below accurately depicts the change in risk premiums that occurred in March.
I’m Caught In a Trap and I Can’t Get Out
The elimination of liquidity in the Canadian corporate bond market could have been avoided, or at least minimized, if:
- Investment dealers accepted that a significant repricing in credit had occurred and sold securities at discounts to market participants, accepting losses on recently acquired positions;
- Dealers had been willing to execute agency trades at spreads wider than inventory price marks. This would have alleviated some of the pressure on market liquidity. This did not happen as the bank-owned dealers would have been “marked to market” based on agency traded levels and their traders did not want to take P&L losses; and
- A Canadian equivalent to MarketAxess existed that would have allowed electronic participant-to-participant trading. Canso utilized MarketAxess extensively in the U.S. and bonds traded on this platform throughout March. Prices were obvious to all participants as they were disclosed via TRACE and this created liquidity.
Liquidity gradually returned to the Canadian corporate market as the Bank of Canada provided the banking system liquidity through a revitalized IMPP program. Rogers Communications, TransCanada Pipelines and The Walt Disney Company executed new issue transactions in Canada.
Hoarding Discouraged: Unless You’re the Government of Course
As businesses shuttered and workers faced the uncertainty of indefinite home confinement, supplies flew off the shelves. Politicians urged citizens to avoid hoarding as these practices were selfish, harmful to the broader community and unnecessary.
No such hoarding rule applies to policy makers and central bankers. In fact, markets cheered when central banks announced plan after plan to restore “normal functioning” in the markets. Normal functioning is a euphemism for “don’t worry, if nobody wants it, we will buy it.”
Distorted Corporate Bond Markets
In our March Newsletter we noted the European Central Bank owned 24% of the European covered, corporate and sovereign bond markets as measured by the ICE Indices. The distorting impact of the ECB’s purchases on the European fixed income markets cannot be overstated.
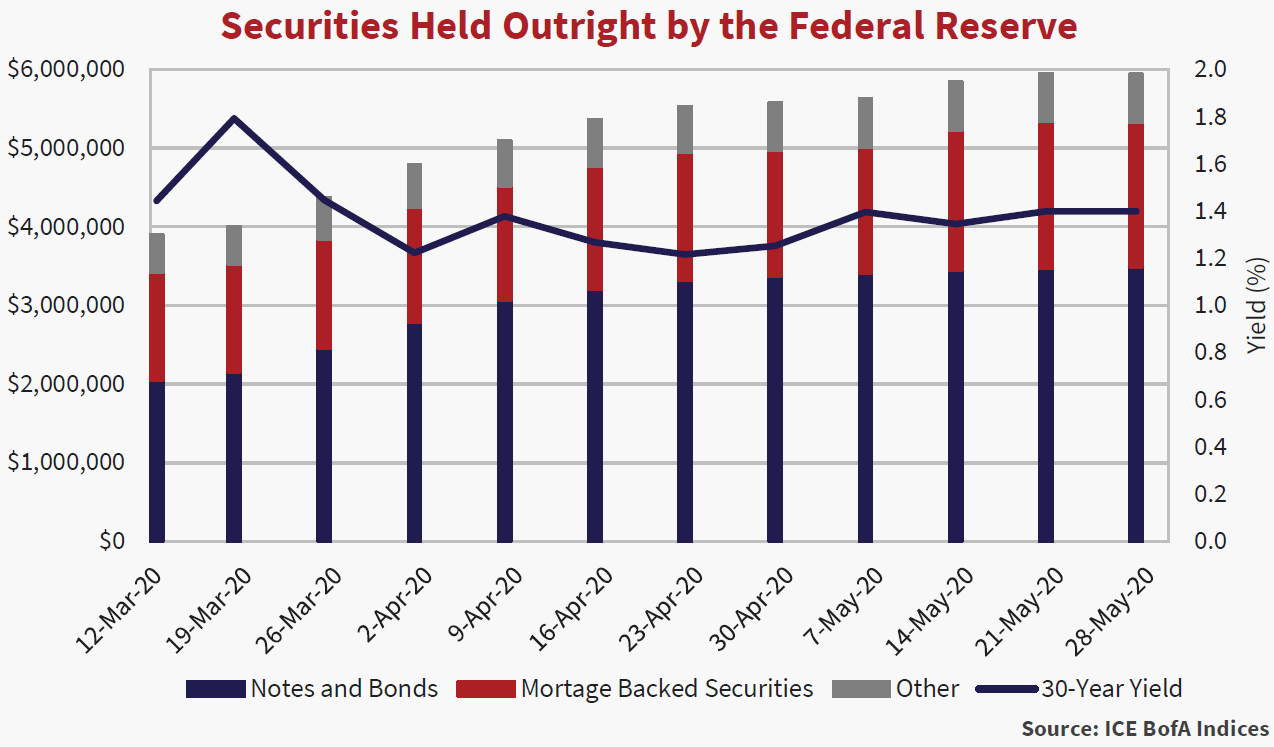
Not to be outdone, the Fed swung into action in early March. When the U.S. puts its mind to something, nobody does it bigger and better than the Red, White and Blue. In 2.5 months, the Fed purchased over $2 trillion of securities – primarily U.S. Treasury notes and bonds and mortgage backed securities. It is likely this is just an appetizer for the Fed as U.S. deficits balloon and U.S. Treasury auction sizes increase commensurately.
Flattening the Curve: Powell Style
Doctors Birx and Fauci have strived to “flatten the curve”, but only the Fed seems to have mastered the art categorically. Jerome Powell, Chairman of the Federal Reserve, is the overseer of unlimited capital and is not afraid to use it. His rapid actions kept U.S. long yields hovering at an eye watering 1.4% for the last 2 months.
Cash is King
There was a day when stuffing cash in a mattress was the stuff of fools. Cash was meant to be spent! A public company had to buy something or a “Corporate Activist” hedge fund came calling and trashed the Executive Floor in their haste to get “Value Creation”.
If that didn’t do the trick, then the pressure was on for companies to “Return Cash to Shareholders” by buying back stock to get the share price up. Borrowing to pay out a dividend was sensible corporate policy.
Now “Cash is King”. How times have changed! As the pandemic spread, predicting the impact on future revenues and cash flows became nearly impossible. Corporate treasurers responded unanimously to the coronavirus lockdown by desperately seeking cash to replace their disappearing revenues. Corporate borrowers drew down revolvers and issued corporate bonds. According to LCD, 737 borrowers drew down $298 billion on revolving credit agreements since March 5th. Over USD $900 billion in investment grade debt priced year to date.
Treasurers who didn’t need the money ignored their wider corporate spreads and focused on the very low all-in yields. Thanks to Chairman Powell taking government yields to historic lows, cagey treasurers locked in very long-term money at very low rates.
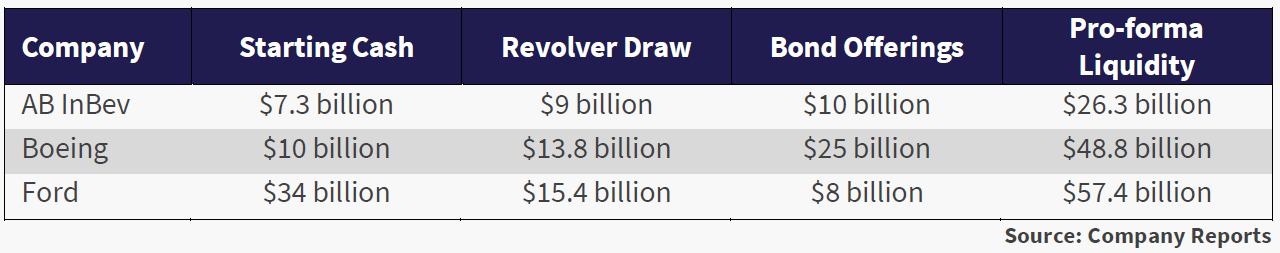
The table below shows just a few examples of the cash raising activities of major corporations.
April Showers
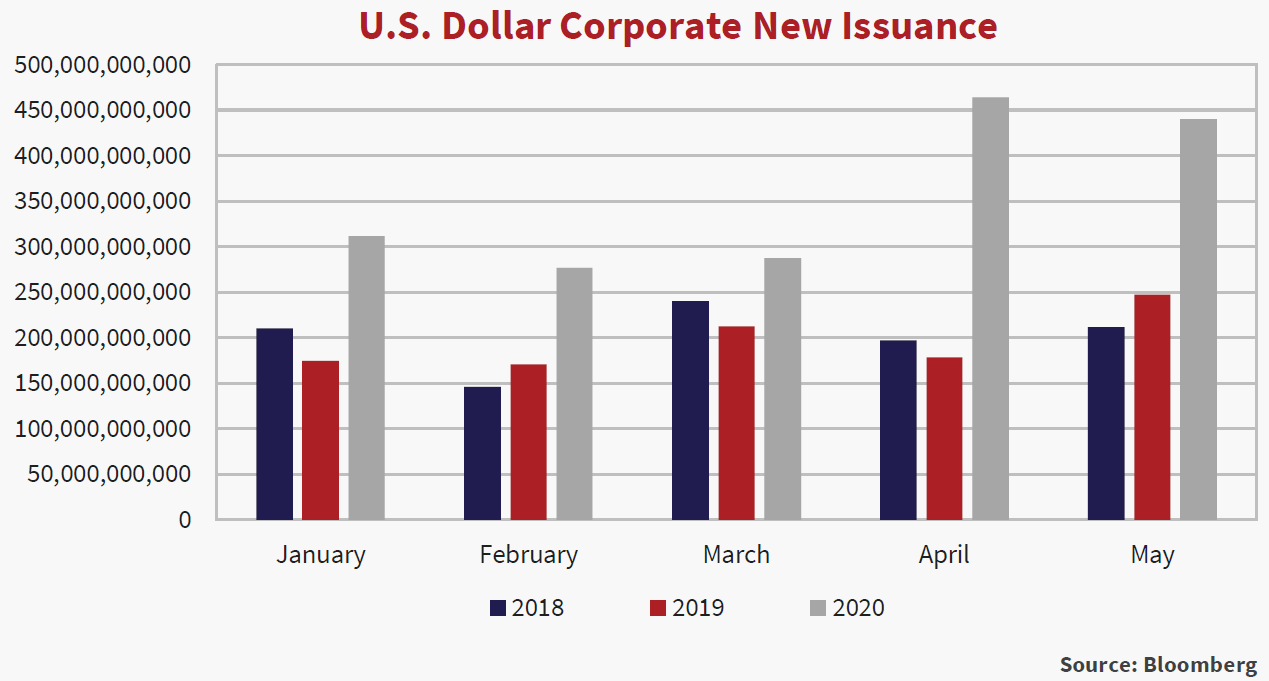
With economic storm clouds building, the U.S. debt binge continued. The perfect storm of stabilizing credit spreads and rock-bottom government yields led to U.S. $464 billion of issuance in April and $440 billion more in May, more than 2.1 times the total from the same two-month period in 2019. Some companies replaced their evaporated revenues, but many saw a once in a lifetime opportunity to lower the coupon on their outstanding debt.
Run For Covered
The same debt binge did not occur north of the border. As noted earlier, in March a major bank fixed income desk refused to bid on their own covered bonds. This sentiment changed quickly during the last week of March, when the Bank of Canada made bank covered bonds eligible for their repurchase program, freeing up liquidity at the banks.
Canadian banks proceeded to issue CAD $59 billion of covered bonds in the final week of March. The vast majority of the issuance went internally, from bank to dealer to collateral through the Bank of Canada. To put that number into perspective, CAD covered bond issuance was $4 billion in full years 2018 and 2019, combined!
Poor secondary market liquidity combined with sticker shock saw less than CAD $5 billion of non-covered bond corporate debt issuance in Canada in the second half of March.
Boeing, Boeing, Gone!!
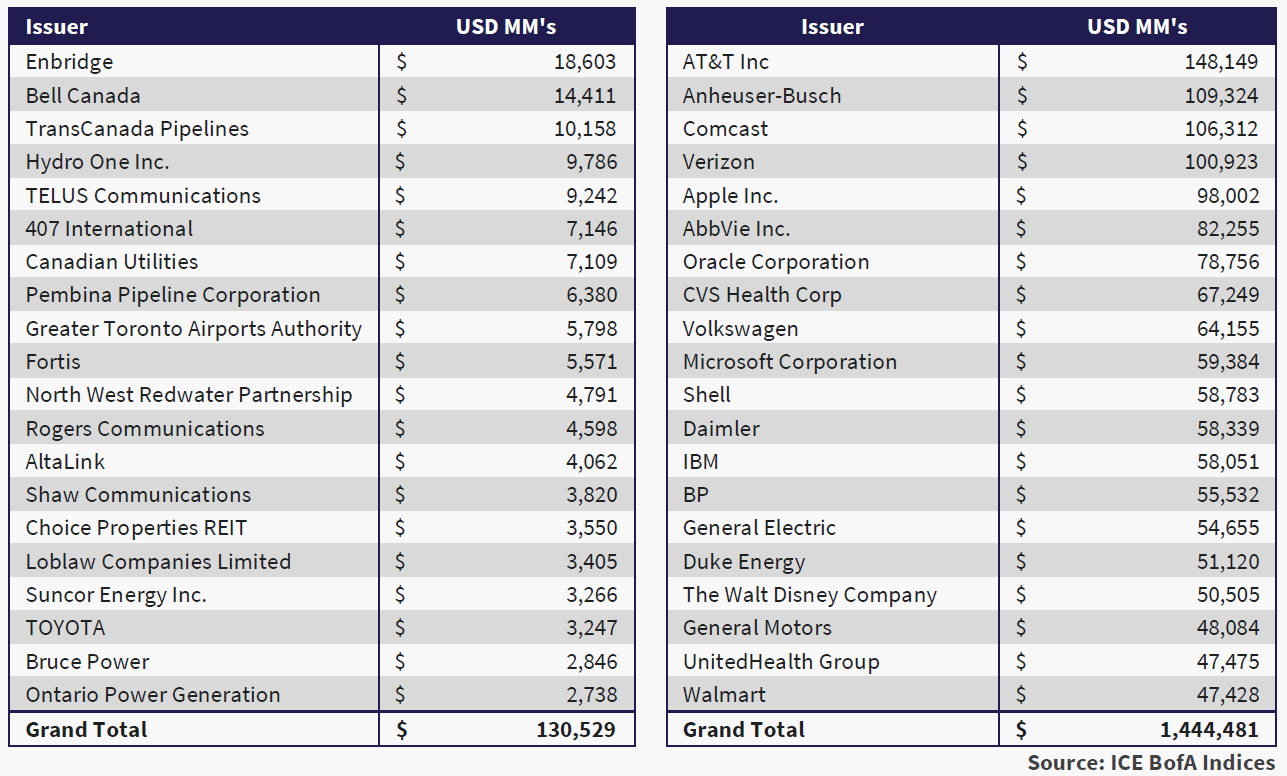
On May 1st, Boeing Co. issued $25 billion of bonds across a variety of maturities. The multi tranche issue met with high demand. It is amazing that $25 billion in bonds, coupled with the company’s $20 billion in existing long-term debt does not make them the largest issuer in the bond markets – in fact they are not even close. Below we show the largest 20 non-financial IG issuers in the CAD and global capital markets as per the ICE BofA Indices. Amounts are in USD.
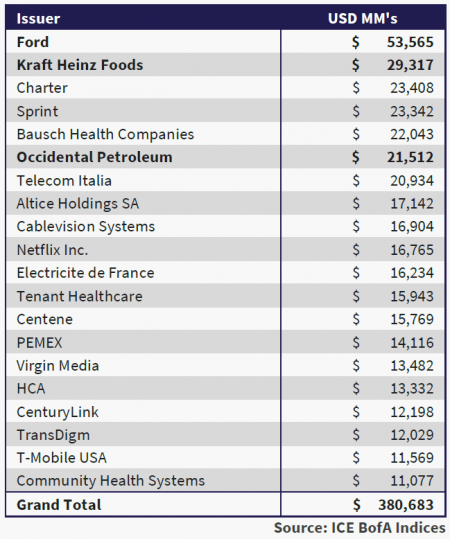
Look Out Below
Downgrades of Ford, Kraft Heinz and Occidental boosted the size of the high yield market. This occurred at a time when very few investors were interested in adding high yield exposure. The chart below shows the largest 20 issuers in the high yield market. Recent additions are shown in bold.
Returns to Normal?
The chart of U.S. HY spreads below highlights the magnitude of the selloff in credit markets since mid-March and relative to historic levels. Spreads hit 1,087 bps on March 23rd, a level not seen since the Credit Crisis.
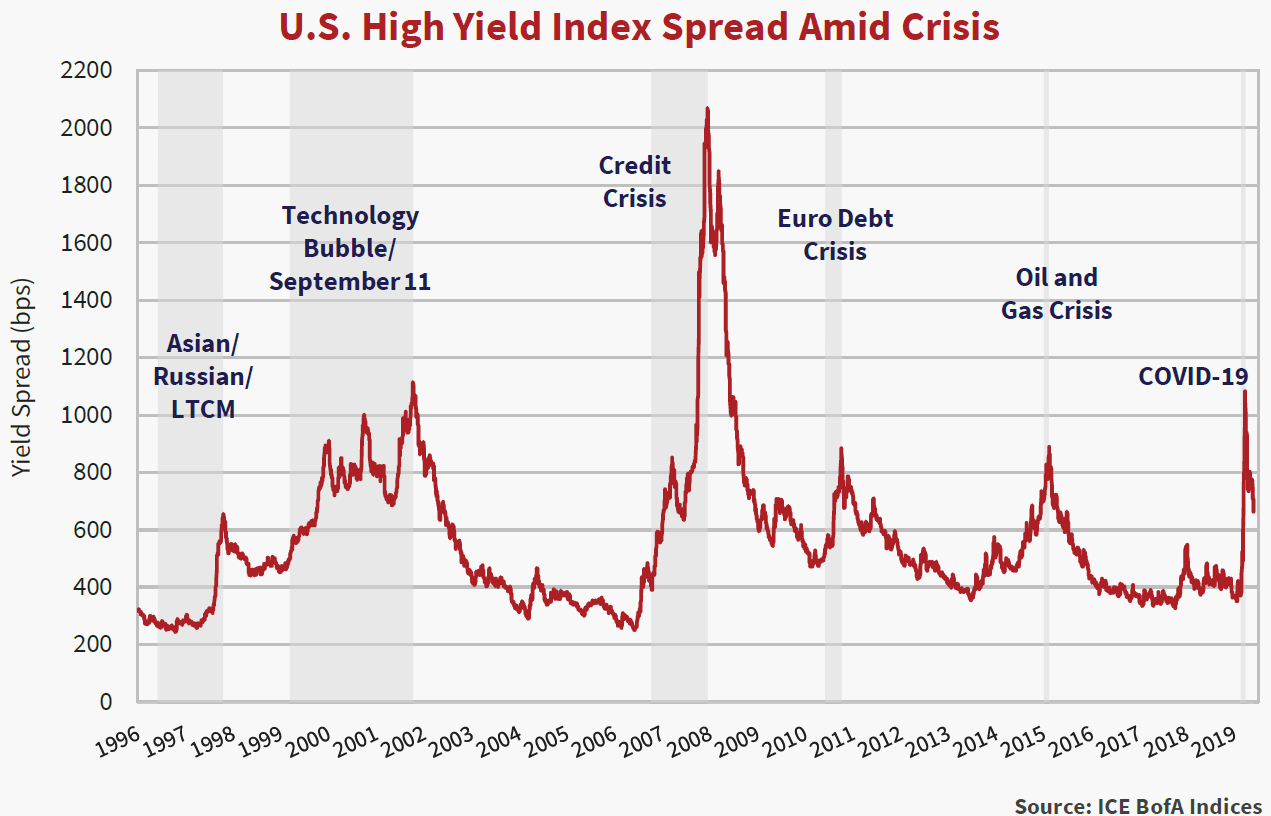
Spreads retraced significantly closing at 654 bps on May 31st. The table below compares HY spread movements during COVID-19 with previous crises.
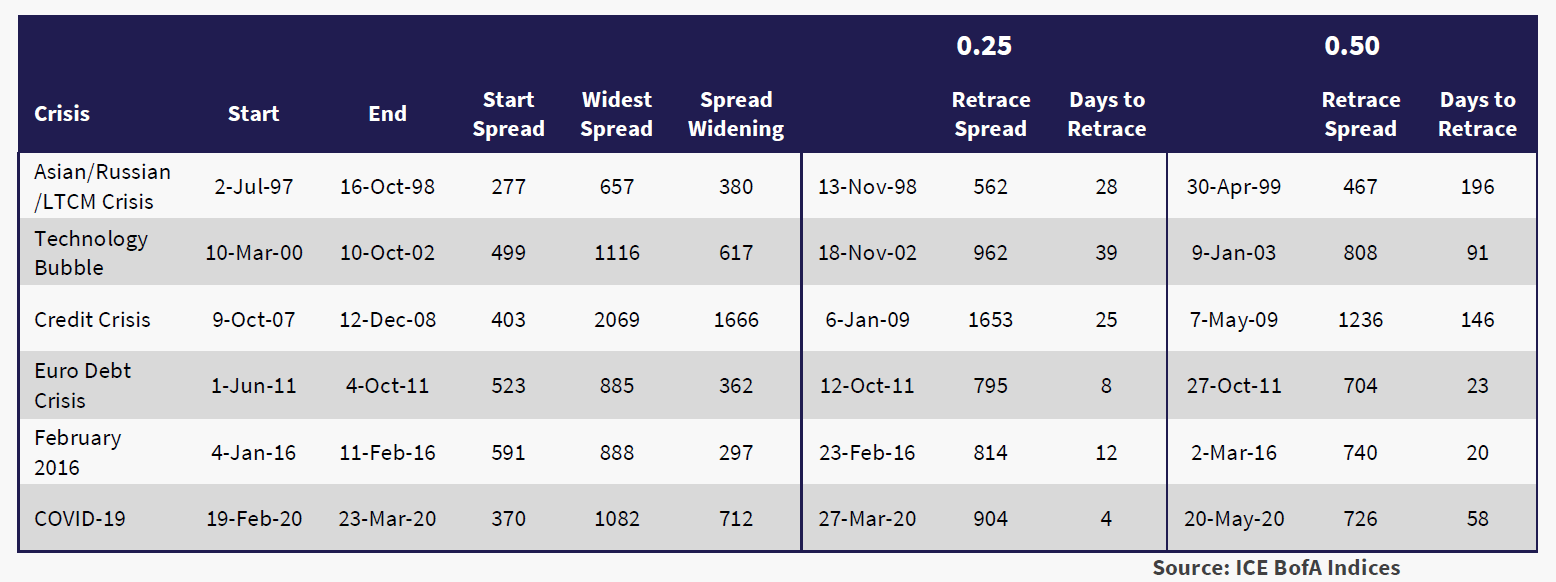
From the wide spread of 1,082 bps on March 23rd, spreads took only 4 days to retrace a full 25% of the widening versus 25 days during the Credit Crisis. The rapid retracement followed the Fed announcement that certain fallen angels were eligible for purchase as part of its market support programs. It took only 58 days to retrace 50% of the widening versus 146 days during the Credit Crisis. The opportunities in times of crisis are significant. Investors need to act quickly and decisively to maximize the opportunity during these crises.
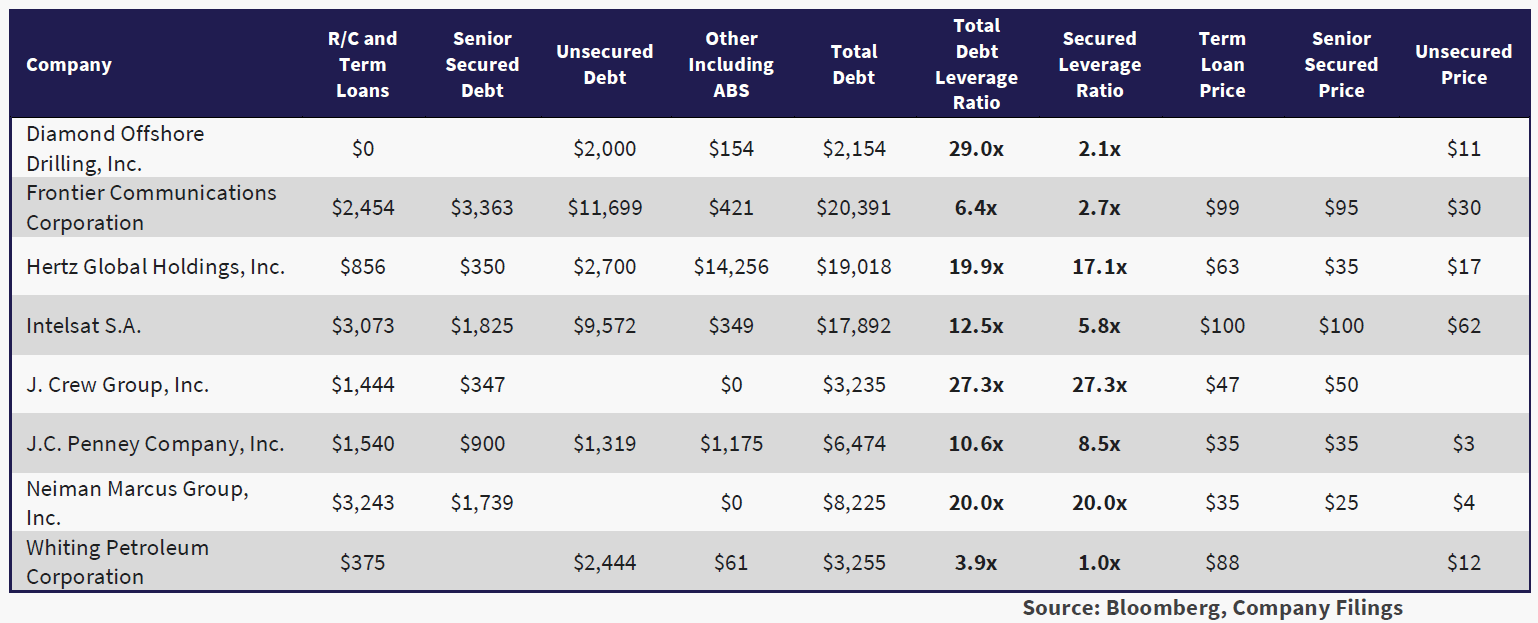
Knocked and Stuffed
COVID-19 combined with leverage knocked the stuffing out of several already teetering companies. The table below lists the larger bankruptcies announced since the start of the pandemic. We’ve provided indicative bid prices across the creditor hierarchy. According to J.P. Morgan, recoveries to first lien lenders in 2009 averaged 61.4%. It would seem based on prices below, recoveries in line with 2009 levels amongst senior creditors may prove a challenge this cycle.
According to J.P. Morgan, in the first five months of the year 41 companies defaulted totaling $71 billion in bonds and loans. The year to date total of defaults and distressed exchanges already ranks as the fourth highest annual default total on record. Only the $205.0 billion in 2009, $84.4 billion in 2008, and $72.9 billion in 2014 exceed this year’s total.
Oops…I Did It Again
Millions of Japanese employed in agriculture, fishing and forestry cooperatives depend on Norinchukin Bank, “Nochu” to its friends, for loans and savings. Until a few months ago, half a world away, a few thousand on Wall Street depended on Nochu to provide capital to the sophisticated operators behind CLO’s. In turn, these sophisticated operators purchased speculative loans, arranged and distributed by Wall Street banks.
On May 27th, Nochu announced a $3.7 billion mark to market loss on the value of its $71 billion in USD AAA-rated CLO holdings. Nochu management stated it is no longer interested in purchasing new CLO securities. If this sounds eerily familiar, in the teeth of the Credit Crisis, Nochu announced losses approaching $3 billion on USD residential mortgage backed securities. Fool me once, shame on you, fool me twice…
Nochu’s situation highlights the tenuous relationship between CLO debt investors, CLO managers, investment banks and the leveraged loan market. With Nochu’s (and other investors) debt financed backing, new CLO’s were formed creating incremental demand for leveraged loans. A virtuous cycle of arranging and distributing provided capital for private equity firms, fees to Wall Street banks with risks borne thousands of miles away. In the absence of Nochu’s (and other investors) debt financing, fewer new CLO’s will be created. Fewer new CLO’s equates to less demand for leveraged loans. Fewer leveraged loans translates to less speculative financing available to private equity.
J.P. Morgan reported $14.1 billion in CLO formation during the March to May period. This compares to $119 billion in CLO issuance in all of 2019. Fewer new CLO’s, stress in existing CLO’s as a result of rating downgrades and defaults, limits the potential for new leveraged loan issuance.
Lean on Me (RIP Bill Withers)
Canso’s investment bias for the last few years was to higher quality. Tight risk premiums coupled with weakened lending standards proved ideal for borrowers at the expense of lenders and did not make much sense to us. On March 23rd, equity markets hit bottom and credit spreads hit levels not seen since the Credit Crisis. Panic reigned as markets repriced. Lack of liquidity, forced risk reduction by levered investors and general market panic created substantial opportunities.
Markets moved rapidly. Transparency and technology allowed everyone to see the magnitude of what occurred in real time. But there is a big difference between seeing and seizing an opportunity. As risk premiums soared, Canso sold high quality NHA MBS and bank bonds to purchase high quality new issues in USD, then CAD and orphaned secondary market securities.
As in previous dislocations, the immediate opportunity proved short lived. Markets hit bottom and recovered somewhat as central banks and policy makers provided limitless backstops. Despite the recovery in risk premiums, we continue to believe it is an opportune time to buy attractively priced BBB and below rated credit.
Security selection is paramount. Investors should consider increasing their allocations to corporate credit in this environment. Our energy is focused on confirming the solvency of issuers to make sure they can survive or there is substantial promise behind their “promise to pay”.
And that’s the way it is. (RIP Walter Cronkite)