We Are All Indexers and All Keynesians
March 31st saw the end of the first quarter of 2020 and it couldn’t come too soon for most investors. It is now hard to believe that the U.S. equity markets reached new highs in February when the COVID-19 epidemic was already raging in China. The Chinese authorities locked down Wuhan, the epicenter of the COVID-19 outbreak, on January 23rd and the peak of the S&P 500 was February 19th, almost a month later. As the table below shows, the S&P 500 increased 4.8% and the TSX increased 5.2% from December 31st, 2019 to their peaks on February 19th.
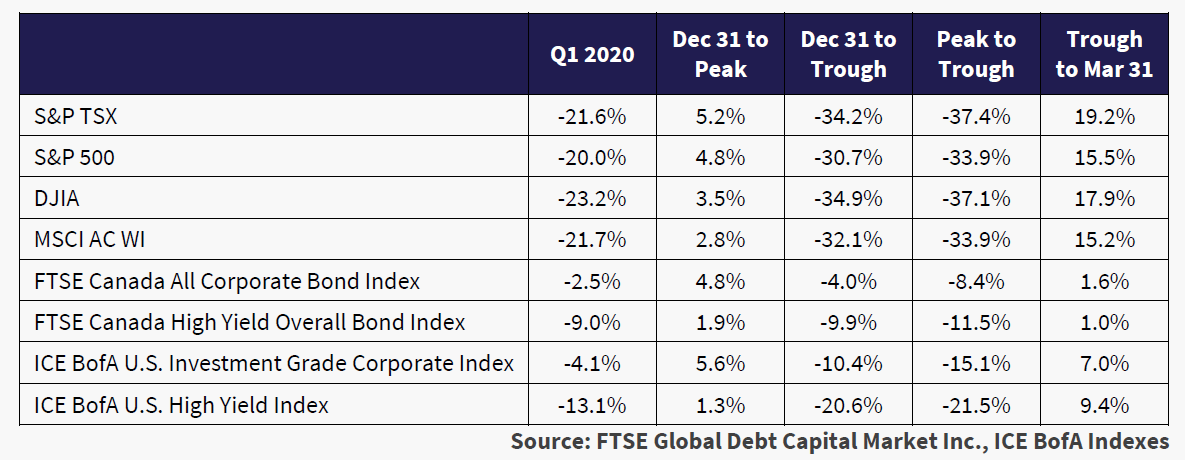
Nobody could have seen that not much more than a month after that, the S&P would be down over 30% and whole sectors of the U.S. economy would be shut down for social distancing in a pandemic. There are not many positive numbers on the table above of financial market returns. It is not just the global health authorities that were unprepared for their pandemic problem; the global financial markets were frozen into stupefied inaction as previous investor ebullience turned to abject fear and the selling started in massive waves.
We All Became Indexers
We all became involuntary Indexers as passive ETFs started very actively selling. This was indiscriminate liquidation and the excellent companies went down with the bankrupt. As a colleague of ours used to say, “When the Paddy Wagon comes, it takes the Good Partiers with the Bad”.
At its worst, the S&P fell 34% from its peak on February 19th to its low on March 23rd. It recovered somewhat over the next week and ended the March 31st quarter down -20%. That was 6 days ago, and the stock markets are again falling, down a further -3.7% at the close this past Friday, April 3rd.
Corporate bonds were hard hit as well. The ICE BofA Investment Grade (IG) Index was up 5.6% on falling bond yields until March 6th and then collapsed as yield spreads blew out. At the worst, it had fallen -15.1% from the peak to its low on March 20th. It recovered into quarter end on March 31st, with a 7% increase, still leaving it down -4.1% YTD. This all took place with declining government bond yields but the yield spread blow out actually increased corporate bond yields.
High yield bonds, the former market darlings that had benefitted from the well documented “stretch for yield” in our newsletters, were crushed. They started the year well, with an increase of 1.3%. Then things went bad very quickly. At the worst, they fell -21.5% and even with a healthy recovery of 9.4% to end the quarter, were still down -13.1% from year-end.
The violence of the selling did not surprise us. We did not predict a viral pandemic, but we had banged the table at the excesses in the financial markets. We said many times that the next downturn would not be a banking crisis, it would be an old-fashioned market sell off sparked by something unexpected and bad happening. A global financial system that had shunned liquidity at its peak in favour of risky investments quickly ran out of its cash and the buyers disappeared. There were few investors left to “arbitrage” the supposedly efficient markets. Even assets like gold that were supposed to protect on the downside plunged on margin liquidation pressures.
We Are All Now Keynesians
The world’s governments have unleashed unprecedented peacetime spending to deal with the pandemic. These are targeted to support consumers and companies. On the consumer side, these range from improved unemployment benefits to direct cash payments to citizens, literally former Fed Chair Bernanke’s “Helicopter Money”. Companies are offered support to keep their employees on staff, various direct loans and subsidies to fund their operating losses. The legislation has been pushed through quickly and is just now being understood by those affected. This fiscal assistance is welcome and necessary, but the bureaucracy of government is struggling to figure out how to deliver this Tsunami of cash with “paperwork to follow”.
We are all now Keynesians. Even the U.S. Tea Party Republicans who were elected to fight Obama debt and deficits have now joined the ranks of the John Keynes fan club. They now recognize his wisdom in saying that governments should borrow to spend when the private sector won’t or can’t as in the present COVID-19 pandemic. These are huge amounts of money.
Trump’s HUGE Fiscal Response
The U.S. has already approved the $2 Trillion CARES Act in record legislative speed. The U.S. Sunday political shows are saying there’s another huge stimulus bill on the way. There’s a lot of money needed. Mark Zandi of Moody’s was on CNN and talked about how the TARP funding was 5% of U.S. GDP in total over a long period of time and the $2 Trillion approved under CARES and $500 billion associated Fed support programs are already 10% of GDP!
Looking at it another way, we can rough cut what is needed. Not all revenues are gone from the U.S. economy. Government workers are still being paid and governments are spending far more than normal. Many sectors like grocery stores, online retailers and delivery services are seeing record business. Other businesses are obviously suffering. Hotels, restaurants, recreation and professional sports have seen their revenues dwindle to almost zero.
If we assume that 50% of the economy will have no revenues for at least three months we’re talking about a 12.5% drop in annual economic activity (25% of 50%). This will all be concentrated in the next few months. If all those lost private sector revenues are replaced by government grants, subsidies and loans, we’re looking at 13% to 20% of GDP. Without moralizing about who is deserving, it looks to us like the U.S. government spending on the COVID-19 pandemic response will approach 20% of U.S. GDP so there’s another $2 Trillion of government spending to come, about $4 Trillion in total. With the Republican Senate, Democratic House and President Trump all competing to see who can do the most for voters in an election year, this might be on the low side.
No CARES About Deficits and Debt
The U.S. deficit was already running at $1 Trillion prior to all this new spending. In our last letter we pointed out that, depending on how long the COVID-19 social distancing persisted, with the current $2 Trillion CARES Bill it looked to us that the U.S. would already have at least a $4 Trillion deficit, financed with debt. Now it looks to us an additional $2 Trillion in spending coming down the pipe with the extra measures now being considered. That’s if the economy gets back to normal in just a quarter, which is optimistic.
Tax revenues will obviously be much lower for some time to come and it is doubtful that a lot of the emergency loans will collect their interest or principal so we’re somewhere already well over the $4 Trillion in spending if it doesn’t take that long to get the economy “back to work”. That’s not including the massive $2 Trillion infrastructure plan that President Trump is now touting as his new miracle cure for the economy. Democrats like infrastructure spending and the Republicans who had fought Trump’s infrastructure plans before COVID-19 are now unlikely to object.
In the political frenzy to make things economically right, ideology has been discarded. We again quote Larry Kudlow’s comments to Fox News last week:
“By the way, I don’t want to belittle it, we have to deal with debt and deficits some point down the road, but during crises and wars you have to sort of not worry about borrowing.”
Kudlow was previously a “Conservative” financial commentator.
The King of Debt Regains his Title
When President Trump was a real estate developer in the 1970s, he called himself the “King of Debt”. He is going to regain his title in the heavyweight division! These are massive amounts of U.S. government debt for the global bond markets to absorb. This is not just a U.S. problem; the large deficit spending programs are happening all over the world. The Canadian Parliament has approved the minority Trudeau government COVID-19 spending with few objections by the opposition parties. As we said last week, that means we’ll see immense government spending globally over the next year that will need to be debt financed and there will be a lot of government bonds issued going forward.
Bond Investors are Worried
The bond market is waking up to the prospect of this looming and massive supply and bond investors are worried. As the chart below shows, the response of the U.S. bond market can be seen in long T-Bond yields. These had been falling since Wuhan was locked down on January 16th to the low yield on March 9th, the day of the stock market meltdown. They rose to 1.9% before falling back to the current 1.2%, still up .5% from the record lowest yield for the long T-Bond of .7% on March 9th.
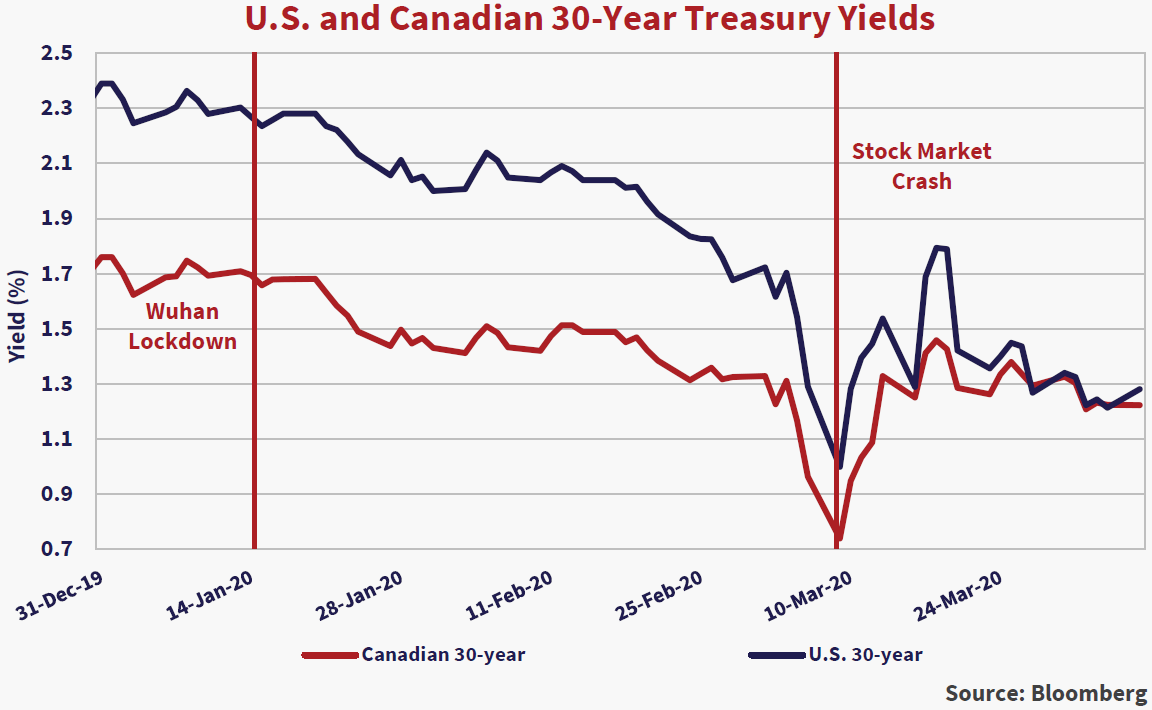
Long Canada bond yields have traced much the same pattern as can be seen in the chart above. The very interesting thing about the chart above is that long Canada yields are now almost the same as long U.S. T-Bond yields after the starting the year almost .6% below them.
Canada Ties on Yields
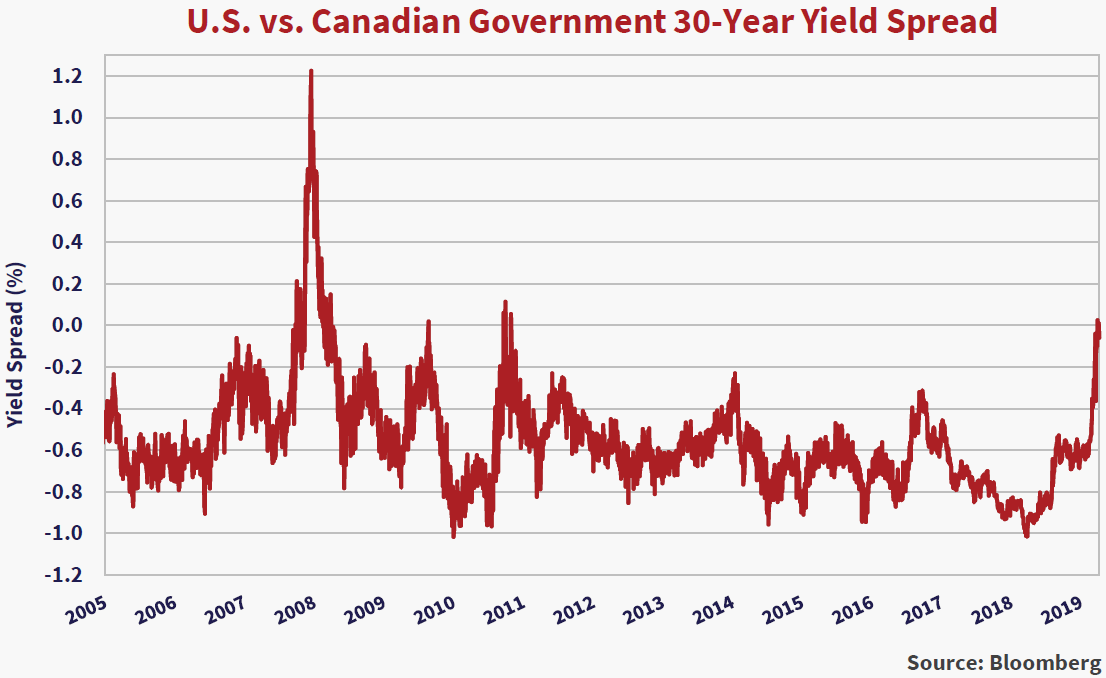
The chart below shows that Long Canada yields have persisted considerably below those in the U.S. for some time, averaging about -.6% below U.S. yields, or a -60bps yield spread, since December 1999. This yield spread has now gone to zero, as long Canada yields are at the same 1.2% as the current U.S. Treasury yield. This is the least it has been since the Credit Crisis in 2008 to 2009 when long Canada bonds went to almost 1% above long U.S. T-Bonds in another flight to bond safety of that time.
Does it have further to go? Well, we’ve always thought that Canada survived the Credit Crisis better than most countries due to its stealthier rescue of the Canadian banking system. Not punishing your banks to pay for their bad behaviour turned out to be a better solution than the public retribution of the U.S. and UK. Canada’s reputation as a beacon of financial prudence led to Canadian bond yields persisting well below U.S. yields, reversing the relationship prior to the Credit Crisis.
Unfortunately, this crisis is not a financial institution panic and the current very low oil and other commodity prices do not favour resource companies and economies. That means we could see Canadian yields increase well above those in the U.S. The U.S. economy is likely to outperform in the rebound so this might persist for some time, if not forever.
Limits to Quantitative Easing?
Will long-term U.S. T-Bond yields continue to go up? The experience after the Credit Crisis was that despite substantial Treasury bond issuance, the Fed’s “quantitative easing” or its buying of government bonds kept bond yields low and inflation didn’t go up. This defied the conventional wisdom that the most inflationary policy of a central bank is to finance its government’s deficits with its bond purchases. In Europe, yields even went negative as the European Central Bank, with its limitless supplies of euros, competed with other buyers. As we pointed out in our newsletters last year, our thought was that the strict liquidity regulations imposed on financial institutions forced them to buy bonds and this explains why rational investors were doing what they were doing.
A Test for “Modern Monetary Theory”
In the current Pandemic response, the Fed and other central banks have already stepped in with “quantitative easing” buying of government bonds. They are also buying corporate bonds in the markets. The U.S. has the luxury of issuing in the reserve currency, so people have to hold their US$ debt. Only time will tell that if the new and now conventional wisdom of Modern Monetary Theory, unlimited bond issuance by governments and unlimited central bank bond buying, will eventually lead to a higher level of inflation.
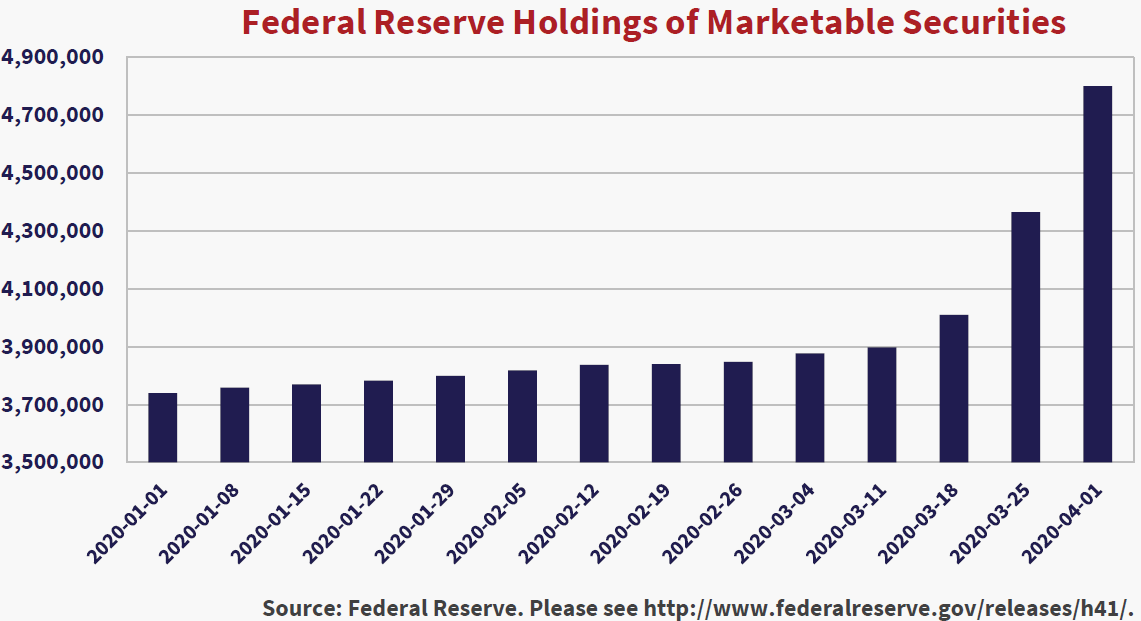
There is obviously some limit to this however, as Argentina, Zimbabwe and Venezuela have proved with their government bond deficit financing and hyperinflation. The Fed publishes its Balance Sheet on a weekly basis and the skyrocketing Fed Balance Sheet is clear for all to see, as we show in the chart below. Between March 11th and April 1st, the Fed purchased $904 billion of securities, $748 billion of that U.S. Treasury Notes and Bonds and $86 billion of MBS. So, we’re already up to $1 Trillion in Fed bond buying even before the CARES Act spending ramps up!
Unmasking De-Globalization
Another thing that worries us economically is the attacks on the established world political and financial framework that served so well for many years. We think that the globalization trend of the past couple of decades is reversing and the good things are getting thrown out with the bad. We have pointed out that the forces of de-globalization were gaining strength long before COVID-19 struck.
Human nature is an interesting thing and the instinct for self-preservation is powerful. There’s nothing like a crisis or a sinking ship to see who panics and who resorts to a self-interested “every man for himself”. Clearly, with President Trump ordering 3M to not export vital N95 masks to its allies like Canada, most countries will be questioning the merits of heavy national dependence on foreign production. It turned out that Canadian companies supplied 3M with the pulp necessary to make its masks, but Canada held its retaliatory fire. It does not help matters that China threatened in its official media to withhold vital drug supplies from the U.S.
Humans Behaving Market Badly
Humans are also behaving badly in the financial markets. We have often told you in our newsletters that financial markets are not the efficient markets of financial market theory. They are made up of very human investors, prone to doing exactly the wrong thing at exactly the wrong time. We have also dwelled numerous times on Professor John Coates’ work on the human physiology of investing. Humans are literally driven by their biological evolution towards the excesses of greed and fear. We titled our January 2020 Market Observer “Full of Bull” and laid out a litany of the market excesses that we saw in the then frothy financial markets and worried about a sharp setback. And set back it did!
Liquidity Became the Only Thing that Mattered
We believe at Canso that investors sacrifice liquidity and quality at market peaks in their frenzy to “get invested”. Our past reports have been replete with stories of investors seeking illiquidity in the “Private Debt”, “Alternative Assets” and any asset class that could be wrapped up in a shrewd marketing pitch. We also say at Canso that “Liquidity doesn’t matter until it is the only thing that matters”. In March, markets went very illiquid very quickly and access to cash became the only thing that mattered.
This liquidity crunch started immediately as panicked investors scrambled to get what cash they could from their portfolios, under pressure from margin calls. Banks were already under funding pressure as their clients drew on their bank lines to fund whatever unknown cash needs lay ahead. Initially the worst economic damage was limited to the travel industry, hotels and airlines, which suffered severe revenue drops as business and vacation travel plans were cancelled. The pain soon spread to almost all sectors of the global economies as the dire situation in Italy and Spain alerted the rest of the world to the wide spread of the virus. Governments strived to “flatten” the curve through social distancing and vast sectors of the global and domestic economies shut down.
Corporate Bonds Suffered Silently
The damage to the equity markets was obvious and everyone has seen the carnage on cable financial news, so we won’t dwell on those details. Corporate bonds sold off as well as our opening table showed. Secondary market corporate bond and loan prices plunged as investors sought to recover their “safe money” from credit mutual funds and ETFs and there were no buyers, only sellers.
The chart below of the Investment Grade Corporate Bond Yield Spread (Corporate less Government Bond Yields) shows how severe the damage to the credit markets was early on. Both U.S. and Canadian IG corporate bonds were still near cyclical “tight” or low levels at 1.25% and 1.35% above their respective Federal government bonds in early March. As the true scale of the COVID-19 problem became apparent, credit spreads started to reflect this increased risk to the finances of corporate bond issuers. Credit spreads in the U.S. jumped to 2% from March 6th to Monday, March 9th when the equity market plunged. It was a one way blow out until the peak was reached at 4% above government bonds on March 24th.
As we said earlier, this damage was not as apparent as the equity market, but it was a tremendous disaster in bond terms. Despite the drop in government bond yields, corporate bond yields soared and prices fell. An increase in yield spreads from 1.3% to 4% in a little over 2 weeks knocked the average U.S. corporate bond price down anywhere from 5% to 20%. And this was the high-quality sector of the credit market. At one point in mid-March, the IG Index was down -15.1% from its February peak.
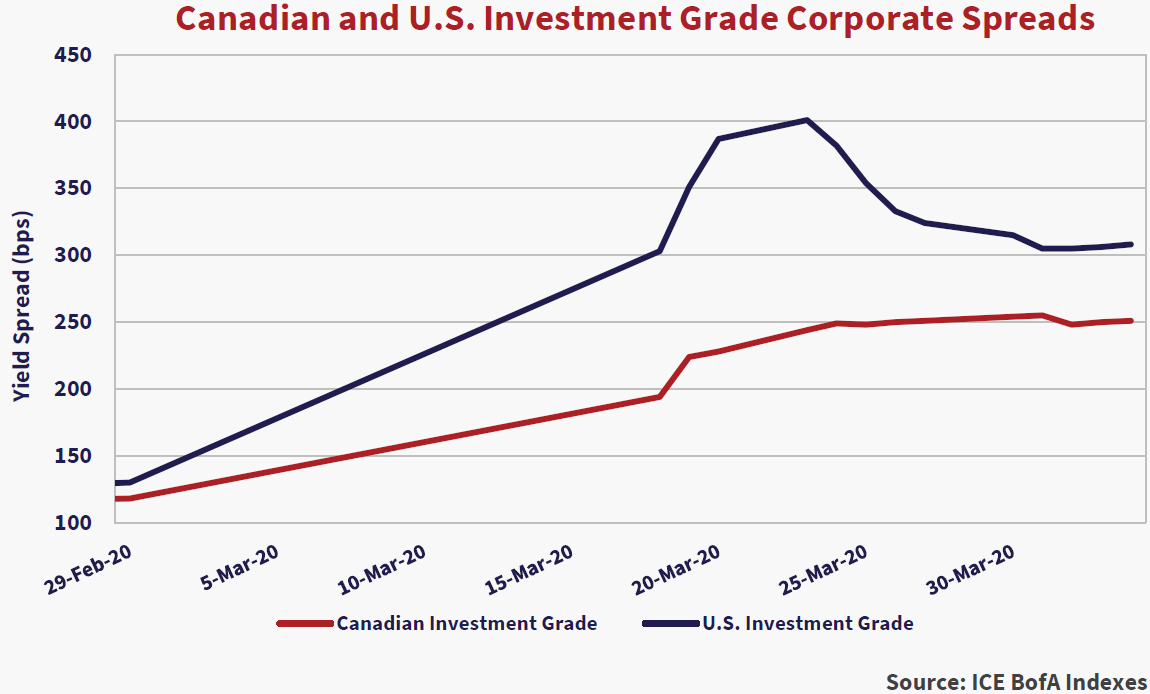
Drinking Fed Liquidity
Things got better in the U.S. with the introduction of the many Federal Reserve liquidity programs which allowed borrowing against corporate bonds and even direct market purchases which included Investment Grade corporate bond ETFs. This led to the U.S. IG corporate bond yield spread contracting or “narrowing” from 4% to its current 3% which saw the IG Index end the quarter at -4.1% which is still quite a “kicking” for investment grade bonds!
Although liquidity has been restored in the credit markets courtesy of monetary easing and direct corporate bond buying, things are definitely not “back to normal”. The chart below shows the spread of the ICE BofA U.S. Investment Grade (IG) Index since its inception in 1996. Current corporate yield spreads, even after the recent rally, are still considerably wider than at any other period since 1996 except for during the financial panic of the Credit Crisis.
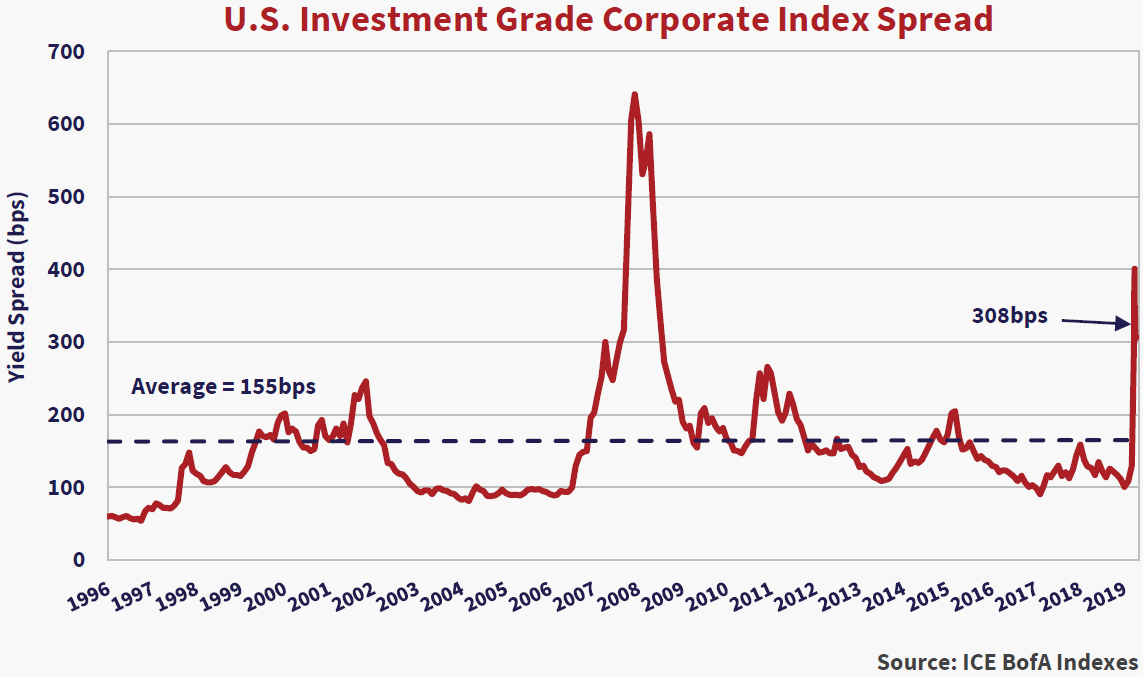
We are currently seeing a wide differential in corporate bond yield spreads. In general, we see spreads are out, as the chart above shows, about 200bps from the levels prior to the pandemic markets. While the IG Index levels “average” out various credit cohorts, with AA much tighter and BBB much wider, there is also substantial differentiation by type of issuer.
Social Distancing Winners and Losers
The bonds of a company like Amazon, which is doing very well with increased e-commerce during the pandemic social distancing are not that much wider than before March. On the other hand, the oil price war between Russia and Saudi Arabia has kept all issuers related to the Energy sector quite wide. The same goes for conventional retailers, hotels, car rental, airlines and any aviation related companies as the market tries to gauge how bad things will get for them and how much support they might get from the U.S. government. The form of government aid is important. The Credit Crisis taught investors that being “rescued” by the government ended very badly for the stockholders and bondholders of some of those companies “helped”.
“Proactive” Raters Are A Problem
The lowest rated BBB issues are already trading at significantly wider spreads than high yield did in the frothy markets of the last few years. The credit rating agencies are not helping matters. They were widely panned for their improper ratings on securitized structures during the Credit Crisis and were forced to “reform” and now claim to be “proactive”. What this now means is that the ratings agencies are seeing the economic and financial uncertainty and rushing to downgrade issuers and this is making a lot of bondholders nervous about their BBB rated companies, some of which are trading now at traditional junk bond yields.
High Yields Got Even Higher
The chart below shows that things are even worse for the below investment grade issuers. These issuers were at very low historical spreads before COVID-19 struck, based on their easy access to plentiful capital as investors bid their prices up and yields down in their frenzy to “stay invested”. It was also comforting that default rates were low. We didn’t think much of the high yield bonds on offer and said so in many of our recent newsletters.
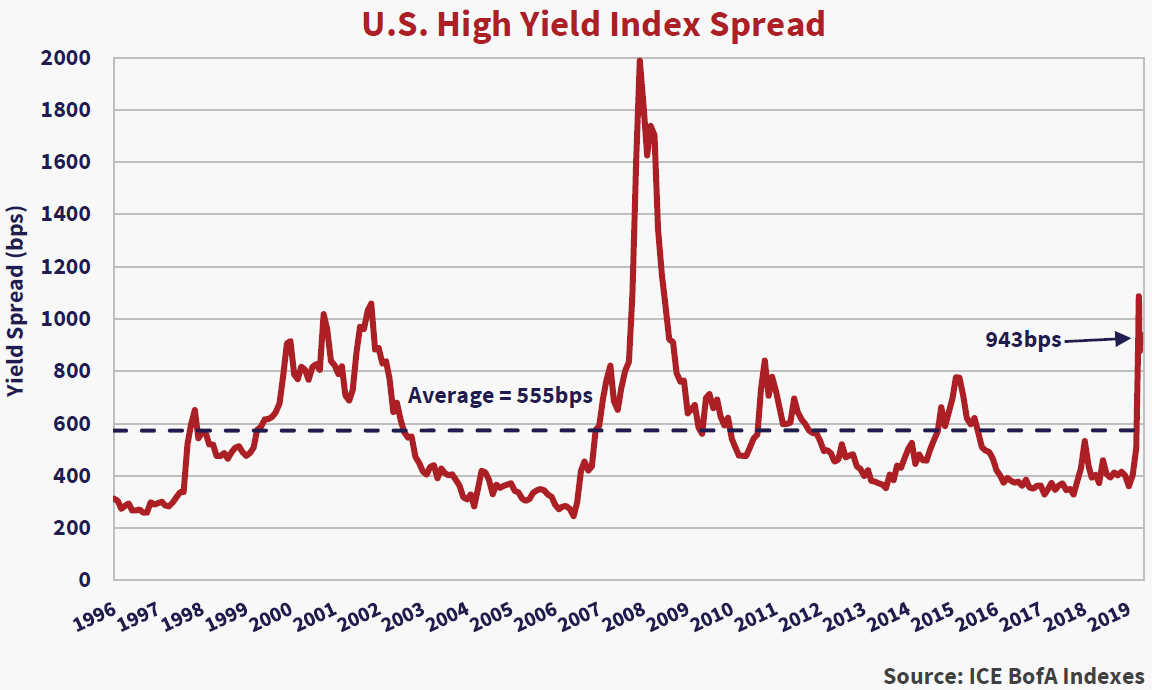
That was a month ago and things have surely changed. The high yield spreads at the current 9.4% against Treasuries are the highest they have been, excluding the Credit Crisis and briefly during the dot.com crash.
Things were terrible in the high yield market as the plunging prices shocked investors in HY mutual funds and ETFs who responded by selling out in droves. We commented many times that constructing a credit index on the basis of market value of issuers bonds didn’t seem wise to us. It meant that the company that issued the most bonds would be the largest part of the index, unlike equity ETFs where the most successful issuers became the largest part of an equity index. At least for now, we seem to have won this argument. The U.S. HY Index was down nearly 22% at its worst and finished the quarter at -13.1%, after a sizable 9% rally but now have set back a further -2.4% in the 3 days since month end.
Only In Canada!
A quick note on the Canadian corporate bond market is in order. Liquidity in the Canadian corporate bond market was only just being restored last week, as Canadian banks accessed the various Bank of Canada repurchase facilities. This started to give the bank owned investment dealers adequate funding to make markets and we found reasonable liquidity for our highest quality bank covered bonds.
As the Red Rose Tea commercial used to say, “Only In Canada!”. The lack of liquidity had a perverse beneficial effect on Canadian corporate bond prices as there was little trading done for almost 3 weeks. The opening table of performance showed that the U.S. IG Index was down -15.1% from peak trough on March 20th where the Canadian IG Index was down only -8.4%. This didn’t make a lot of sense since Canada has a higher weight in Energy and Resource issuers. What we noticed was that Canadian bond pricing, supplied by the inactive Canadian investment dealers, considerably lagged U.S. levels for the same issuers.
The chart below of long Enbridge Inc. bonds in both US$ and C$ clearly shows this. The long Enbridge spreads in the US$ markets were .5% or 50 basis points (bps) below those in Canada in February. On March 9th with the equity market cratering, the US$ spread gapped out to 390bps where the C$ spread only made it to 269bps. The US$ then made it to 600bps before falling back to end the month to 375bps, .25% through the C$ spread.
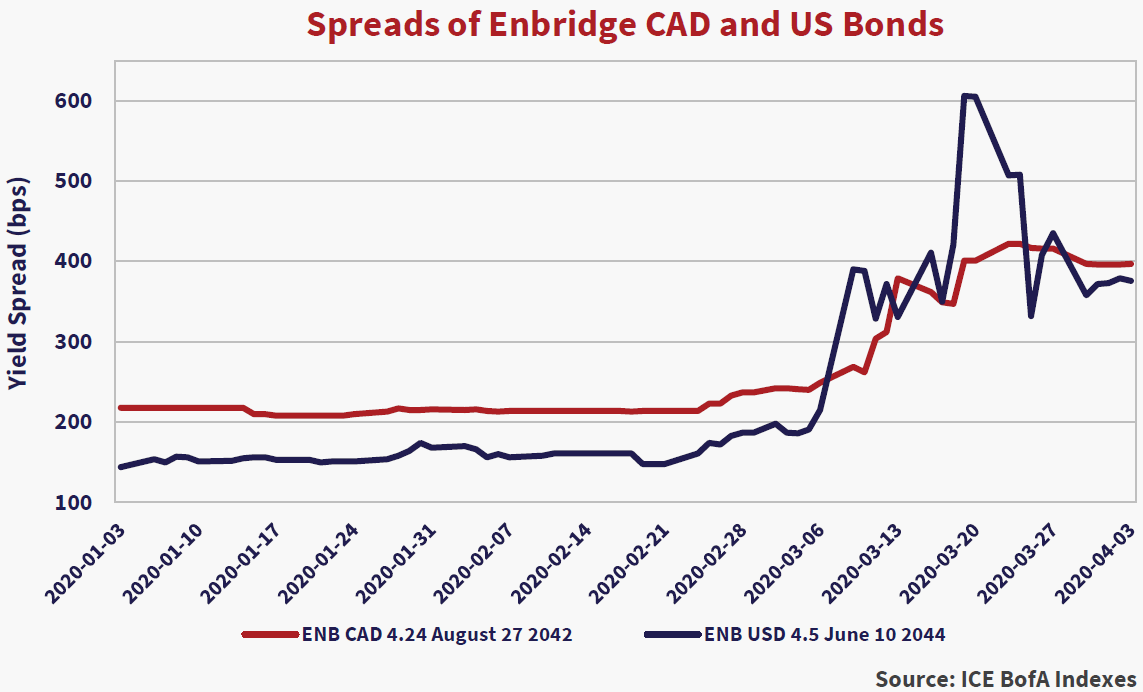
We are still finding that many C$ bonds of the same issuer are at considerably lower spreads than the US$ levels. This is quite a change than before the COVID-19 Crisis when US$ spreads were lower than C$ for the same issuers. Eventually, traders will have the capital to arbitrage these differences but for now, that’s the least of anyone’s worries.
What’s Ahead??
The real question is what is ahead for the pandemic. We are not medical experts, but it seems to us that the countries that have implemented the most restrictive social distancing and lock downs have fared the best with the COVID-19 pandemic. This has given them time to ramp up their medical systems and cope with the most serious cases. Italy and Spain are seeing very high mortality rates as their medical systems were overwhelmed before their social lockdowns took hold. The good news is that their lockdowns are working and their new cases are stabilizing and even dropping.
The U.S. Response Was Very Late
Clearly the U.S. was very late to implement their lockdown, which has still not been put in place in a number of States. The reasons for this are varied and very political, so we’ll leave that to the politicians. The medical experience in other countries shows that the infections peak about 3-4 weeks after the social lockdown starts in earnest.
The U.S. hotspots in Washington State and California seem to be stabilizing after their lockdowns but New York, New Orleans and other large cities are struggling. This means to us that we are probably at least 3-4 weeks away from the peak in most of the U.S. As President Trump now admits, the situation will be grim for the next few weeks. When cases peak, the U.S. medical system will be better able to cope. Testing, Personal Protective Equipment, Ventilators and N95 masks and other necessary medical equipment will be more available to the patient demand and things will seem better.
Markets Will Normalize
When will the markets get “back to normal”? The problem is that the U.S. financial markets and economy drives the world financial markets and the U.S. has lagged in its pandemic response. We expect perhaps a month of tentative steps to “restart” the economy while observing partial social distancing so we’re still a good 2 months out from even a partially restored economy. Things will inevitably be better economically by year-end, but the support programs and monetary stimulus will likely remain long after that since there is little chance that anyone will be complaining, given what we have all been through.
Looking Through to “Economic Normal”
The market will start to look through to restored “economic normal” in the not too distant future. That said, it is very difficult to pick winners and losers economically in all this so security selection will dominate portfolio management. With the ETF mania that made investing “easy” for the past number of years, security selection was not a valuable skill set as everyone clamored for indexed portfolios.
We think that this will change with realization that indexed ETFs were a terrible burden on the financial system as selling dominated investor behaviour and we all became indexers as ETF selling dragged down the good with the bad. Many ETFs traded at market prices vastly different from their underlying NAV values, as the ETF plumbing clogged the selling drain. The fact that the Fed had to step in directly to buy corporate bond ETFs is instructive as to their marketed “magical liquidity”.
We are doing a lot of buying of cheap bonds and now are spending much of our time differentiating among issuers in their valuations going forwards. The huge liquidity assistance provided by central banks to the markets has considerably narrowed spreads, but the good news is that many securities are still very cheap on a normalized basis. The question is, when do we get back to normal and we are now focused on the path to get there.