We know that our Canso clients and friends are interested in what we are thinking and what we are seeing in the markets. We’ve sent you a couple of letters from John Carswell, our President and CIO, but we thought you might want a more fulsome explanation than we’ve previously given. We’re pretty busy in the markets and things are changing quickly, so we thought it would be best to do a few shorter “Market Position Reports” on the current market conditions and where we think things are going forward. We expect to send out a few of these shorter updates before we get back to our regular newsletters.
As you might know, John Carswell was an RCAF air navigator in the days before GPS, when you did celestial navigation and plotted your positions on paper plotting charts by hand. One of his duties was to prepare the “Position Report” or “Px” to tell the aircraft position to air traffic control and Air Transport Headquarters when flying over the vastness of the Atlantic Ocean or the Canadian Arctic. You were completely on your own, so it was important that someone knew where you were!
In Unknown Territory
So, where do we think we are on the investment front? Things are truly in unknown territory and as novel for the markets as the unexpected Novel Coronavirus was on the medical front.
Social distancing is causing huge swaths of the global, U.S. and Canadian economies to shut down. As we said in our last letter, we don’t know exactly what will happen with the medical situation, but we can make some educated guesses. We can also translate that into economic and financial scenarios for individual companies and governments and then extrapolate their prospects going forward. This is what we are now doing with all the possible effort we can, to position our portfolios properly for what we expect and might encounter going forward.
Record Debt and Little Cash
What of the economy? There are some very dire predictions out there for the economy and unemployment. Clearly, things are dire. Some of us are lucky to be working from home and with employers that are more insulated from immediate economic impact. There are also many people without any income because of social distancing and the lockdown of many areas of the economy.
We know that both companies and consumers have gone into this totally unexpected situation with record debt and very little cash on hand. That has meant that companies and consumers are drawing on their credit facilities to get them through the next few months. The good news for consumption is that people now have the ability to use their home equity and borrow on their lines of credit. This compares to earlier periods when you drew down on your savings.
Funding Stress on Banks
What this has meant for banks is breathtaking. Companies are drawing down their bank lines to have the cash on hand to prepare for the coming drop in their revenues. Consumers are doing the same thing. That has put huge funding stresses on banks since they don’t have the cash to meet these demands. Bank treasurers have been struggling to meet the demand for funds.
While we are still in uncharted territory, we now know far more about the policy response of governments. The first policy response was monetary, as the central banks around the world lowered interest rates. The Fed quickly cut rates .50% and then another 1% to leave the upper band of the Fed Funds rate at 0.25%. The Bank of Canada (BOC) followed. This lowered market interest rates, the price of money. It didn’t do much for the availability of credit, so the central banks soon opened up their “liquidity windows” and let banks start to borrow against a wide variety of collateral.
Credit Markets Illiquidity
With the economic and financial uncertainty, credit markets had frozen. Yield spreads on corporate bonds soared, as bank owned investment dealers stepped back under funding pressure. Redemptions from mutual funds and ETFs climbed and they needed to fund withdrawals but there were few bids for their selling. Leveraged credit players were suffering margin calls and liquidation from their Prime Brokers. Cash was clearly at a premium and the value of financial assets plunged.
Liquidity From Central Banks
The next, and very welcome move of central banks was to unleash various programs to restore some liquidity to the markets. The U.S. government once again guaranteed money market mutual funds as they had during the Credit Crisis to allow the Commercial Paper markets to function. The Fed also amped up its quantitative easing programs, buying bonds directly in the markets.
Interestingly, this included buying corporate bond ETFs. We have told you for some time that ETFs couldn’t possibly be more liquid than the underlying corporate bonds that they owned and the Fed now obviously agrees. They are directly buying the Investment Grade corporate bond ETFs that are suffering huge outflows to keep secondary bond prices from tanking.
Fiscal Policy to the Rescue
In our letter last week, we pointed out that the proper policy response of governments would be fiscal policy. The good news is that, compared to the aftermath of the Credit Crisis and following recession, governments are much more willing to do what is needed on the fiscal front. Governments of all political stripes are now throwing aside ideology and politics to do what is needed. In the U.S., these fiscal programs are necessary to deal with the massive scale and speed of the shutdown of the U.S. economy. They are also unprecedented in their sheer scale and dwarf the spending after the Credit Crisis by a huge margin.
Huge Deficit Increase Ahead
As we have told you in past newsletters, the Trump Administration was already running record peacetime deficits before the Coronavirus struck. The actual deficit for 2019 was $984 billion and is forecasted to be $1.1 trillion for 2020. Even based on an unrealistic 3% economic growth rate it climbed to $1.8 trillion by 2030. Clearly the current spending bill being passed by Congress means that the deficit that will likely approach $4 trillion in the next few years as economic growth is much slower than forecasted.
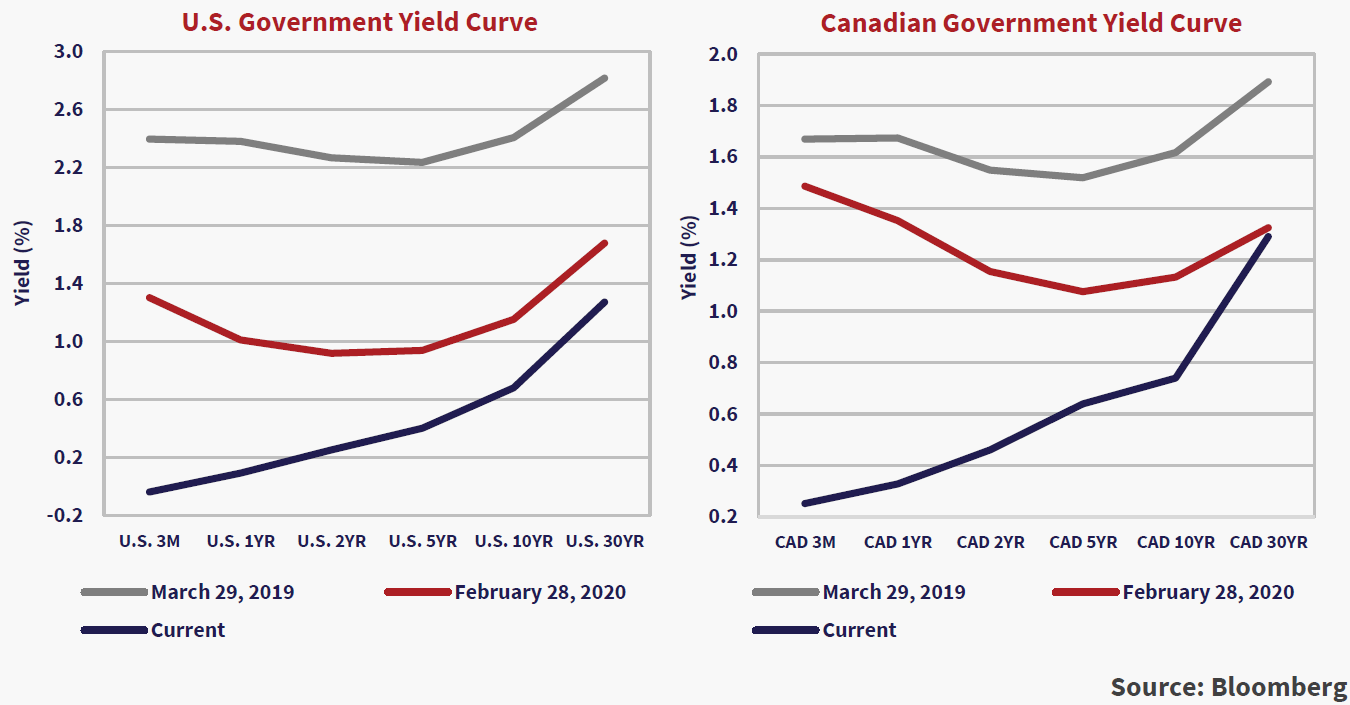
The increase in Treasury bond yields from their lows seems to reflect the market consensus that there will be a lot of Treasury bonds being sold to support the cash injections to the U.S. economy. This is reflected in the current steepening of the U.S. Treasury yield curve that is now very positive as can be seen from the chart below.

A year ago, 3-month U.S. T-Bills were 2.4% compared to a 30-year T-Bond yield of 2.8%, making for an additional yield of .4% by extending term for thirty years. In bond market parlance, this was a “flat yield curve”. A month ago, things weren’t too different with the 3-month at 1.3% and the 30-year at 1.7%, again making for a .4% increased yield.
Steepening Yield Curves
Things are sure different today. The Federal Reserve had already made an “emergency” move on Sunday, March 15th, and lowered Fed Funds to zero. This put the 3-month T-Bill slightly negative at -.04% at the close on Friday, March 27th, but the 30-year Treasury had increased to 1.3% since its low of .7% on March 9th. This put the yield curve at a much higher and “steeper” 1.3%. This also tells an interesting economic tale, one with considerable hope for the economic future. A steep yield curve is not a bad thing, it usually presages a strong economy ahead as bond investors demand a higher yield as they see higher growth and inflation ahead. Investors know that this will end but recognize that there will be huge Treasury issuance for some time to come.
Canada has seen an even more dramatic change on the yield curve front as the chart above shows. While 3-month T-Bills have dropped to .25% from 1.5% a month ago on Bank of Canada easing, the 30-year Canada is still at the same 1.3% yield that it was one month ago. This makes for a 1.1% pick up in yield and a steeper Canadian yield curve.
Long Bond Investors Worry
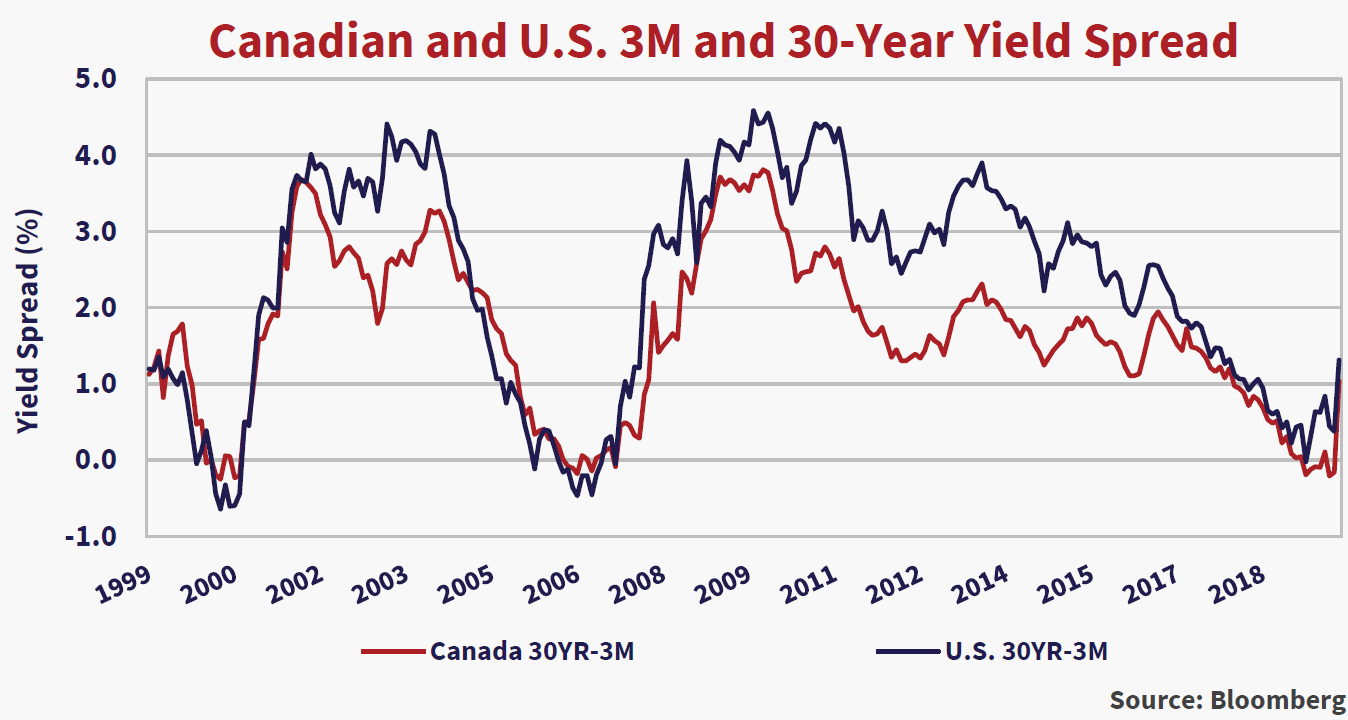
To us, the bond market is reacting to the scale of the fiscal stimulus and debt-financed spending programs. The chart below of the spread between U.S. and Canadian 3-month Treasury Bills and 30-year Federal government bonds shows the “steepness” of the yield curve over time. The yield premium has now jumped from .4% to 1.3% in the U.S. in the past month. It has moved to 1.1% in Canada.

Since 1999, the yield curve spread between 3-month T-Bills and 30-year Treasuries has run at about 2%. The current 1.3% spread takes us back to 2017 levels. This is still historically low. We expect that long-term bonds will increase in yield with economic improvement while short-term rates will stay anchored by Fed policy for some time to come. This could get us to the 3-4% levels of 2002 to 2005 and 2009 to 2011 coming out of recessions. The implementation of quantitative easing after the Euro-Debt crisis in 2011 seemed to hold long-term bond yields down, but this time around there is immense fiscal stimulus and huge amounts of bonds to be issued to fund it.
Whatever It Takes
As we’ve said earlier, the U.S. government is unleashing huge amounts of fiscal stimulus, as it should. It’s rather breathtaking that the Republicans, who objected to TARP and fiscal stimulus during the Credit Crisis and Great Recession under Obama, are now arguing for “whatever it takes”. We are frankly amazed about what is now happening with the scale and scope of the large spending programs in the U.S. that are being put in place to deal with the economic damage from the COVID-19 pandemic lock down.
Steven Mnuchin, the U.S. Secretary of Treasury, appeared on Fox News Sunday last week and discussed the various programs that the U.S. Congress was rushing to pass into legislation. Mnuchin is reported to have told Republican Senators that they had to approve the legislation or risk having unemployment jump to 20%, as high as during the Great Depression of the 1930s.
Mnuchin sure made his point. The initial $1 trillion program had jumped at that point up to $1.8 trillion only two days later and finally ended at $2 trillion when signed into legislation by President Trump this past Friday. There will also be up to $4 trillion in lending by the Federal Reserve to affected industries.
You Have to Not Worry About Borrowing
Frankly, the Republicans in the Senate seemed to be competing for even bigger spending on the COVID-19 response than the Democrat controlled House of Representatives. The numbers are staggering and it seems there is more to come. Larry Kudlow, Trump’s economic advisor commented on Fox News that:
“By the way, I don’t want to belittle it, we have to deal with debt and deficits some point down the road, but during crises and wars you have to sort of not worry about borrowing.” He said… Kudlow continued, “This country is so strong and our credit is so good and our currency is so reliable that we can afford to borrow money. Right now, the average cost would be 30 or 40 basis points, that’s all. That’s a tiny price to pay to invest in the men and women and small businesses and so forth to keep the economy going.”
Yields Still High for Corporate Bonds
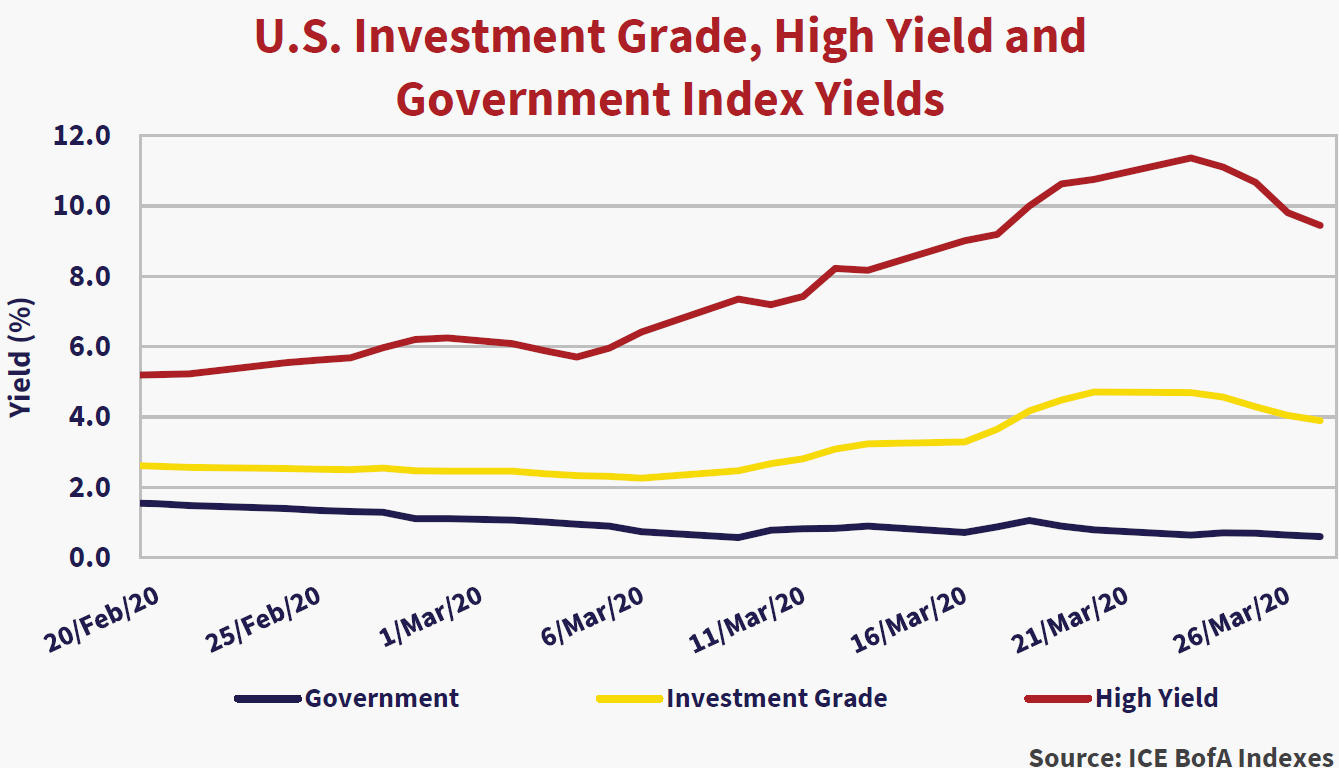
In our letter last week, we showed you the chart below of the yields of the ICE BofA (ICE) U.S. Treasury Bond (T-Bond), Investment Grade (IG) and the High Yield (HY) Indices. We did this to give you an idea of how much and how quickly corporate bond yields had risen in the U.S. The T-Bonds Index is .6% today, a 1.2% decrease in yield from 1.8% at December 31st, 2019. The IG Index has increased in yield to 3.9%, down from the peak last week of 4.7%, but still an increase of 1.0% from the 2.9% at the end 2019! High yield bonds had a yield of 9.5%, a decrease from the peak of 11.4%, but still an increase of 4.4 % year-to-date.

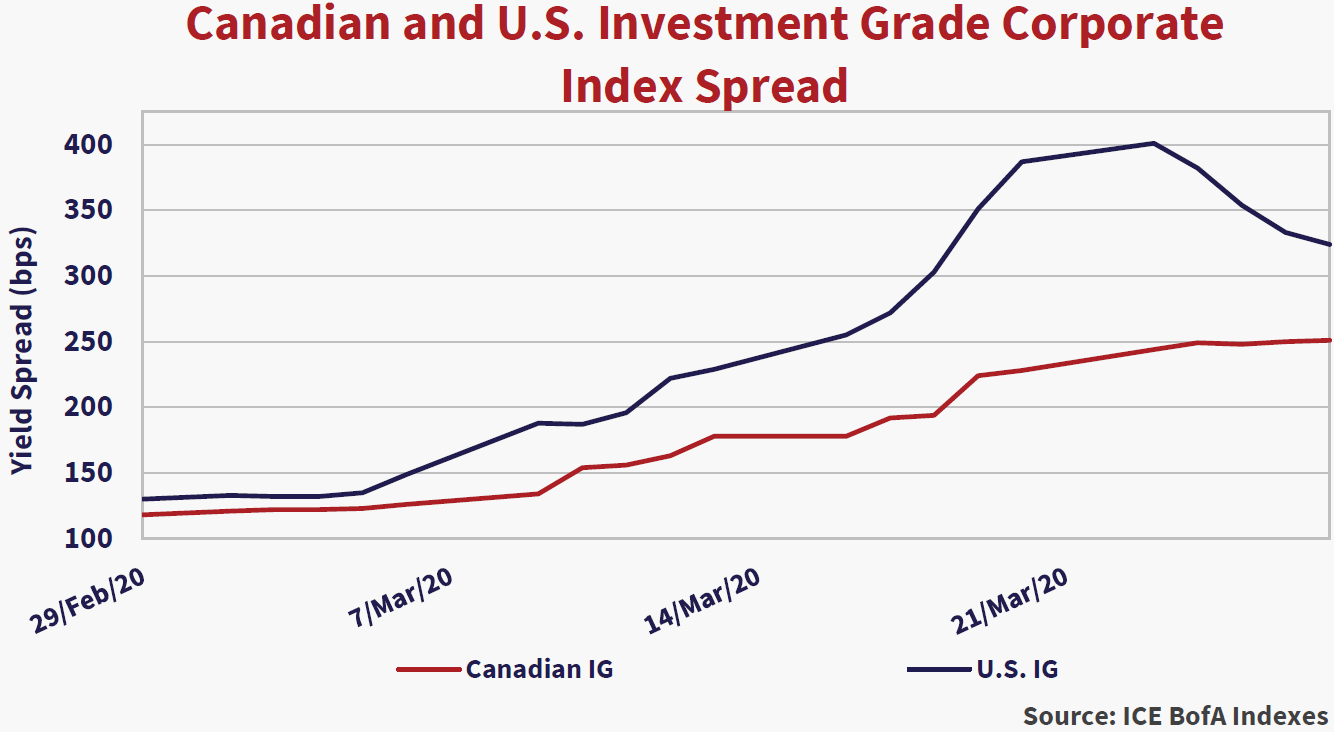
The sharp increase in the yield spread on the IG Index (IG minus T-Bond yields) can be seen in the chart below. The spread widened by 2.75% in three weeks before March 24th, before falling back from the peak spreads. This happened after the Federal Reserve Investment Grade corporate bond lending facility kicked in, which improved liquidity in U.S. credit markets considerably over the course of the past week.
Canadian Corporate Spreads Increased Less
Canadian yield spreads increased during the period, but not nearly as much. We think this comes from the illiquidity in the Canadian corporate bond market compared to the U.S. Canadian banks had funding constraints and the Bank of Canada lending facilities had not started so there was not much trading. This meant that traders did not mark their books to market and they didn’t “gap” to the wide trading levels in the US.
The Canadian Insured Mortgage Purchase Program (IMPP) and the BA Repurchase facility started early this past week. This created increased liquidity in NHA MBS and provided funding to Canadian banks. Since the banks used these up quickly, the BOC increased them substantially in size. We expect the trading in Canadian corporate bonds to increase with the opening of the BOC corporate bond repurchase program this coming Monday, March 30th.

Corporate Revenues Plunge
So that’s what we are seeing in the markets. At the macroeconomic level, the best we can say is that governments are doing what they have to fiscally but there will be a huge supply of government bonds ahead. On the economic front, we expect many companies to have much lower or no revenues at all for three to six months. The government support programs are coming but the current stress is driving companies to draw their bank lines and issue bonds to cover the shortfalls in revenues while they await the support to get them through the COVID-19 economic lock down.
Our best guess is that it will be at least two quarters of severely reduced or no revenues for many companies and their employees. How does this translate into the economy and financial markets? Well, you’re looking at a 50% drop in economic activity in some industries, but some sectors, like utilities and medical services will not see large drops. Government expenditures will not be substantially reduced, although their tax revenues will fall only to be shored up with borrowings. Since consumption is by far the largest driver of economies, we’re probably talking a 30% annual drop, mostly in the next couple of quarters.
The Economic “Knock On”
There will be an eventual recovery and rebound but it is very hard to predict the “knock on” effects. Some industries and companies are actually doing better in all this. Food producers, grocery stores and medical equipment companies are running full out in production to meet the unexpected demand. Online retailers like Amazon are hiring huge numbers of people to meet home delivery demand as a result of “social distancing”.
Disappearing Travel Revenues
Business and leisure travel have completely stopped. Airlines, Hotels and Cruise Lines have literally seen their revenues disappear. Marriot hotels furloughed their staff and the Wall Street Journal reported that their CEO said this was the worst situation in its long history with business down 75%.
“Marriott Chief Executive Arne Sorenson said in a video message to employees on Thursday that Marriott business is now running about 75% below normal levels, making this period more devastating than any other in the history of the nearly century-old hotel company. He said that the financial impact was worse than the post-September 11, 2001 period and 2008-2009 financial crisis combined.”
Unknown Unknowns
There’s a lot going on and a lot of “unknown unknowns” in terms of the medical situation and the economy going forward. It seems to us that the initial phase of market panic and illiquidity is fading due to the central bank and government support programs, as the drop in U.S. corporate bond yields has demonstrated. The medical uncertainty remains and will keep a lid on any market ebullience for some time to come. Once it becomes clear that social distancing has checked the spread of COVID-19, markets will impound the eventual economic resurgence and respond.
Musical Chairs in the Dark
Markets and the investors that compose them are sorting through things and deciding which companies will do well financially and which will suffer. The government support programs have been rushed through, but people still have to figure out how they work and who benefits. This will take a lot of time and guesswork, as historical financial statements provide absolutely no guide to the year ahead.
We’ve been thinking about the current situation and how we might explain it to people. It seems to us that our investment research is a bit like playing a game of musical chairs. We have to decide where we will be when the music stops and whether there will even be a chair to sit on. Even worse, someone has turned the lights out and we have to feel our way in the dark!
The Tyranny of the Bid/Ask Spread
We have harped many times in our newsletters about liquidity and the trading tyranny of the “Bid/Ask Spread”. It was not so long ago that we pointed out that it didn’t matter what you thought your investment was worth if you had to sell and the only bidder had a much lower price than you wanted.
Early in March, liquidity evaporated on fears of the unknown and market prices plunged for all securities as bids dropped ever lower. Offers were slow to follow on the way down and the bid/ask spread widened massively. Most trades took place at the “bid side” which was much lower as those with cash to spend demanded huge returns on their capital. This meant prices “gapped” down with breathtaking speed.
As the central bank liquidity programs swung into action, markets started to improve and the panic selling lessened. Buyers started “lifting offers” and sellers waited for better prices and prices “gapped” higher. That said, prices are still well down from a month ago. Things will eventually improve and those with capital to invest can still find great values and will make money as things normalize. We’ve already seen substantial increases in the prices of many of the bonds we have bought in the past weeks.
We wish you good health and high spirits in your social distancing!
Canso