The Maple Leaf Forever
On July 1st our beautiful country Canada turned 150 years old. From border to border, ocean to ocean, Canadians young and old took time to celebrate life in the greatest country on earth. And what’s not to celebrate? It could be Canada’s breathtaking natural beauty, limitless opportunity in a truly free society or the tenacity, humility and humour of our fellow Canadians. We hope whatever you do in Canada’s 151st year, you and your family are healthy and happy and revelling in your “Canadianness”.
He Went to Paris
Since we last wrote, Emmanuel Macron won the French Presidency and then the French Parliament, both in resounding fashion. Très bien! UK Prime Minister Theresa May called a snap election and gambled away the remaining years of her mandate, losing her majority and what little leverage she may have had in Brexit negotiations. Mon dieu! The White House withdrew from the Paris Accord despite objections from corporate, political and mainstream America. Zut alors!
Foreign Buyers Beware!
The Ontario Government introduced a foreign buyer’s housing tax in Toronto and a bump to the minimum wage. Argentina successfully priced a 100 year bond with foreign buyers forgetting its propensity to default. Many Australians discovered they were dual citizens. The yield curve flattened. Credit spreads tightened, and on it goes.
You Are My Sunshine
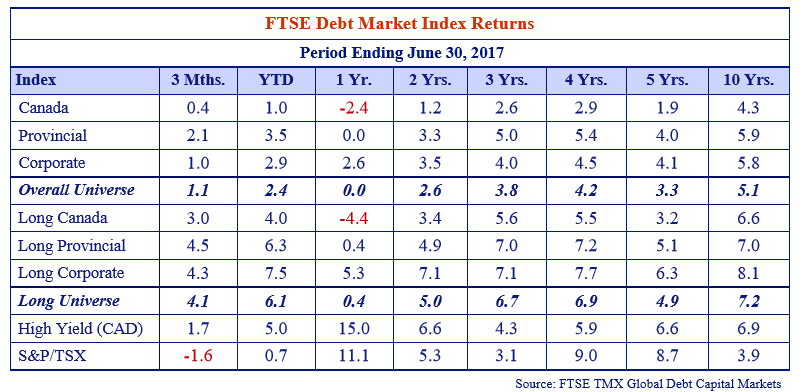
Canadian corporate bond investors smiled as tighter credit spreads offset rising government bond yields. A dispirited Canada bond investor saw a -2.4% return for the year to June 30th, 2017, from rising yields where his friend investing in corporate bonds enjoyed a +2.6% return.
Corporates returned 1.0% during the 3 months ending June 30th, 2.9% YTD and 2.6% over the last year, outpacing Canada bonds by an impressive 60, 190 and 500 bps respectively over those periods. Long corporates returned 4.3%, 7.5% and 5.3% over the same periods for even greater outperformance of 130, 350 and 970bps versus long Canada’s. Truly stellar!
A Sample of Ample
If you’ve been paying attention to Canso for the last several years, you know we’ve been expecting interest rates to rise. You would also be well aware Canso holds long corporate bonds across most of its portfolios. Why you might ask would Canso hold long duration assets in an environment where we expect rates to rise? The answer lies in one of our favourite Canso’isms – we make investments when compensated for the risk assumed.
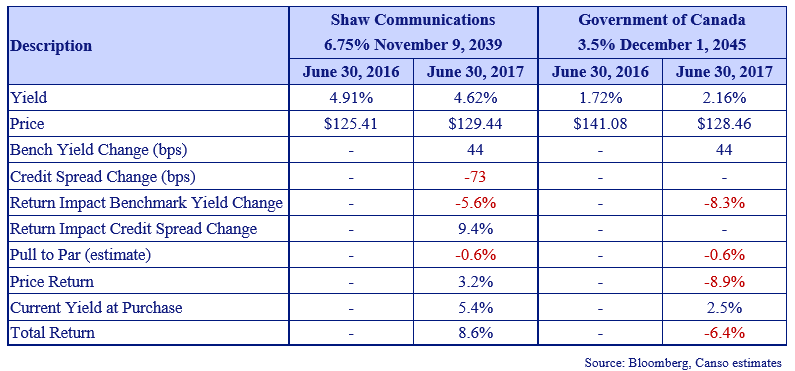
In the 12 months to June 30th, the long duration Canada bond index returned negative 4.4% versus the long duration corporate index’s positive 5.3% return. How can this be? Simply put, the price erosion caused by rising yields was more than offset by credit spread narrowing plus the higher running yield of long corporates. We highlight a specific example below.
Over the 12 months ended June 30, 2017, the Shaw Communications 2039 issue returned 8.6% versus a negative 6.4% return on Government of Canada 2045’s – the benchmark off which it is priced. The 44 bps increase in yield of the Canada 2045’s was more than offset by 73bps of credit spread narrowing of Shaw and its higher current yield of 5.4% versus Canada’s at 2.5%. It paid to own a long Shaw bond and we were more than amply compensated for the risk we assumed!
Of course, one needs to make sound credit judgments about a company’s ability to pay. That is why Canso employs over two dozen credit analysts to tear companies apart top to bottom and bottom to top.
The Change It Had to Come
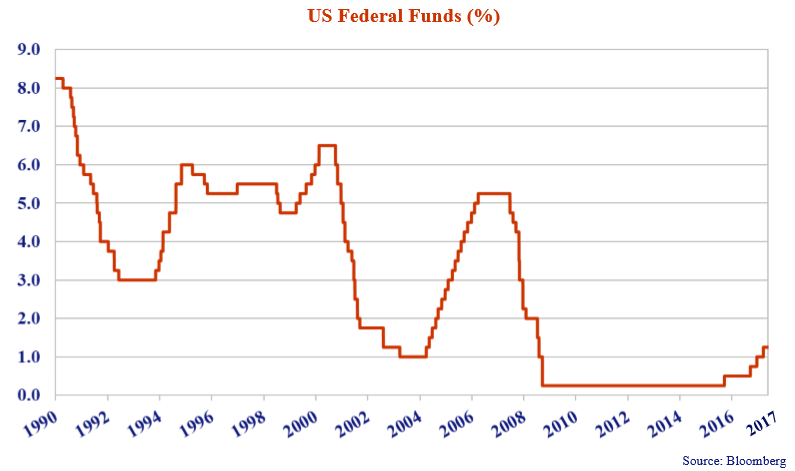
On June 14th, the Federal Reserve raised its benchmark interest rate to 1.25%. This came on the heels of a 25bps hike at the Fed’s March 15th meeting. Per the graph below, after hiking rates 100bps since December 2015, we are happy to report the US Fed Funds rate is now – well – still unbelievably low by historical standards.
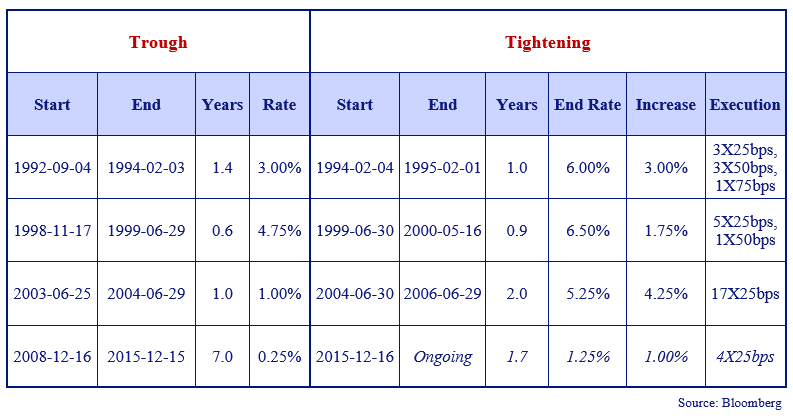
We looked back at the previous three prolonged Fed tightening cycles with results presented in the table below. As illustrated, the trough to peak rate increase was 1.75% on the low end (6 tightenings) and 4.25% on the high end (17 tightenings). The current tightening cycle is striking for the 7 year duration of the trough and the gradualness of the rate increases of only 1.00% over 1.5 years. With September (19-20th), October (31-1st) and December (12-13th) meetings left yet in 2017 Ms. Yellen has some work to do!
Question Mark and the Mysterians
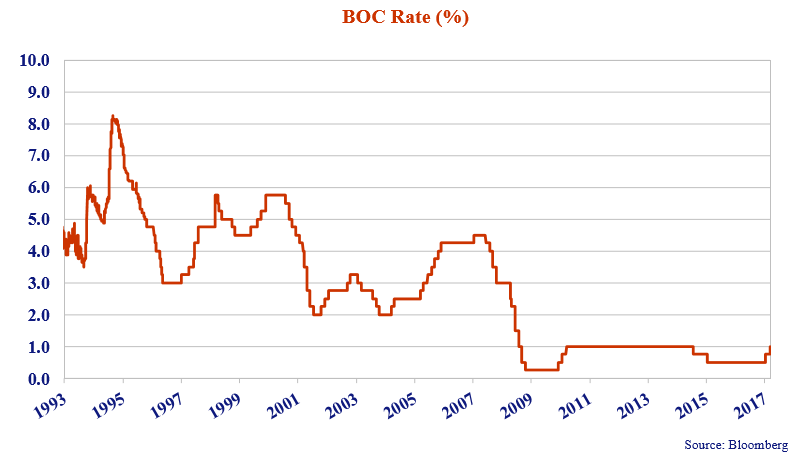
Meanwhile at the Bank of Canada, Mr. Poloz and company raised rates 25bps in early July and most recently an additional 25bps on September 6th. These two rate hikes reversed 2015’s oil price shock induced rate cuts which we viewed as unhelpful. Highly indebted Canadians are likely saying the same about these rate hikes. Remaining BOC meetings in 2017 are October 25th and December 6th.
A Churning, Burning Feeling
Central banks and central bankers attract enormous attention. The next two years will be particularly important as the terms of three important players are up or nearing completion – Ms. Yellen’s term at the Fed expires in February 2018, Mr. Carney’s at the BOE in July 2019 and Mr. Draghi’s at the ECB in October 2019. All this senior central banker churn will happen in a period where the Fed will continue to raise administered rates and begin reducing its balance sheet, the BOE will contend with the economic realities of Brexit, and the ECB may cease QE. We hope the churning will not end up as burning.
This Beat Goes On
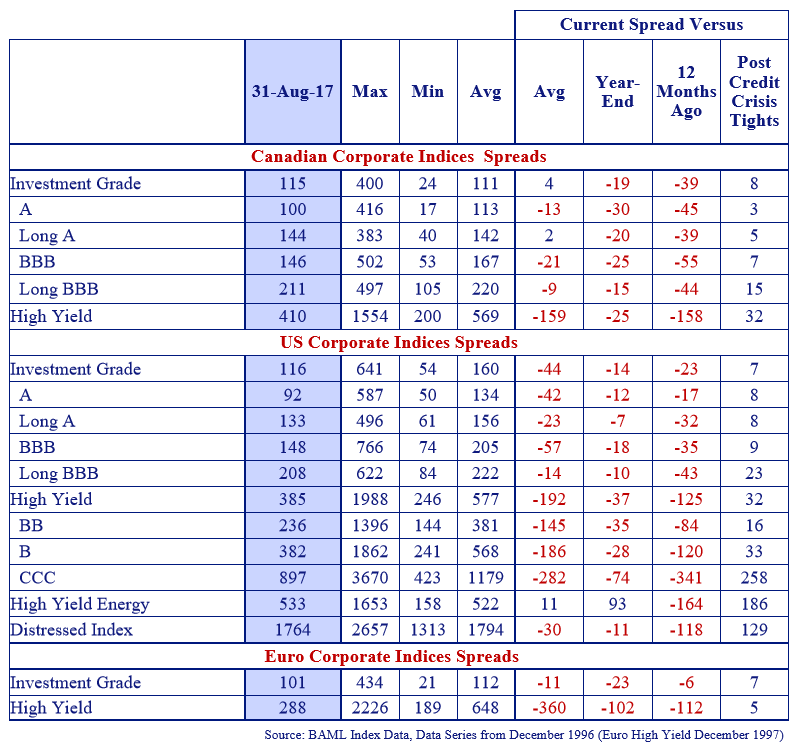
The credit beat goes on, as the corporate bond market remains resilient – at least for the moment. Since early 2015, it has paid to be long credit and loving it! At August 31st, Canadian investment grade credit spreads at 115bps were a mere 4bps above historic averages and 19 and 39bps tighter than year-end and 12 month ago levels. US and Euro investment grade spreads at 116 and 101bps are 44 and 11bps through long term averages, 14 and 23bps tighter than year end levels, and 23 and 6bps tighter than 12 months ago.
High on High Yield
Just when we thought they couldn’t get much higher, the high yield markets continue to defy gravity. Investors are besotted with credit risk and have bid up its price. The BAML Canadian high yield index is 159bps through its historic average of 569bps and 158bps tighter than 12 months ago. The US and Euro high yield indices are 192 and 360bps tighter than average and 125 and 112bps tighter than year ago levels. The reach for yield continues.
We’re Here for a Good Time
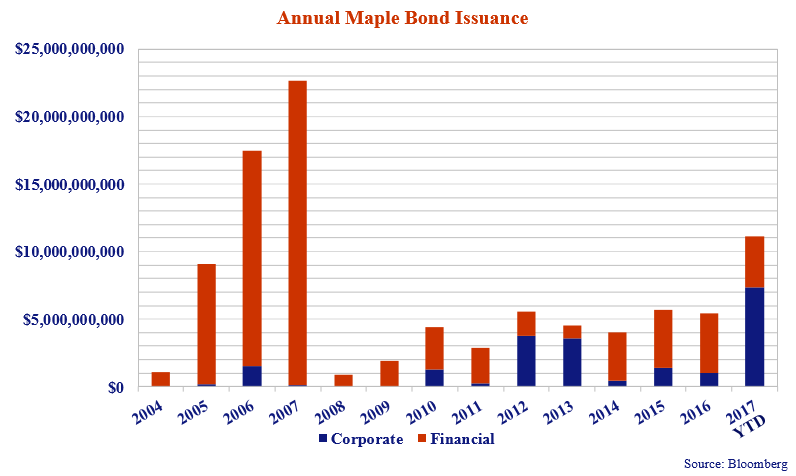
The Maple bond market consists of non-Canadian issuers borrowing in Canadian dollars. In 2007, Maple bond issuance totalled $22.7 billion or 21.5% of total CAD corporate issuance of $105 billion. Post credit crisis, Maple bond issuance averaged a modest $4.3 billion from 2009 – 2016 or 4.3% of average CAD issuance during this period of $99.3 billion. Per the graph below, the Maple market is alive and well in 2017 with YTD issuance of $11.1 billion or 13.5% of total CAD issuance YTD of $82.3 billion.
First time issuers Apple Inc. ($2.5 billion 7 year), AT&T Inc. ($600 million 7 year and $750 million 30 year), PepsiCo, Inc. ($750 million 7 year) and United Parcel Service Inc. ($750 million 7 year) joined returning issuers AB Inbev, Bank of America, Goldman Sachs, Morgan Stanley and Wells Fargo & Co. in tapping the market so far this year. Notably, corporate issuers comprised the majority of issuance at $7.4 billion versus financials at $3.8 billion.
Why the spike in issuance? Maple issuers tend to be serial borrowers and at various points in time Canada provides an attractive alternative source of funding. A Maple bond can provide issuers:
- Cost effective funding;
- Investor base diversification; and
- Revenue match to Canadian operations (e.g. AB Inbev).
The resurgence in Canadian issuance follows a period when a number of outstanding issues were called for redemption or matured including issues of Commerzbank, Goldman Sachs, Lloyds Bank and Royal Bank of Scotland.
At My Signal, Unleash Hell
On June 7, 2017, in a deal orchestrated by the ECB’s Single Resolution Board (“SRB”), the failing Banco Popular Espanol SA was taken over by Banco Santander.
“The SRB decided to exercise the power of write-down and conversion of capital instruments prior to the transfer, to address the shortfall in the value of the Institution. In particular, all the existing shares (Common Equity Tier 1), and the Additional Tier 1 instruments were written down [to zero], while the Tier 2 instruments were converted into new shares, which were transferred to Banco Santander S.A. for the price of EUR 1.”
This “resolution” was great for everyone except for shareholders and subordinated bondholders. The sale was completed with no state aid and the customers of Banco Popular saw no change. All depositors continue to have uninterrupted access to the full amount of their deposits. Banco Santander also raised €7 billion in additional common equity as part of the transaction.
Importantly, shareholders of Banco Popular received nothing, and subordinated note holders received equity in the bank, which is essentially worthless. In short, this is how the resolution of a failed financial institution is supposed to work. One would expect this to be held up as a model for future failed bank resolutions. Except…
For the Glory of the Empire
On June 24th, the European Commission and the SRB (yes the same SRB that resolved Banco Popular on June 7th) approved Italian measures to facilitate the liquidation of Banca Popolare di Vicenza and Veneto Banca under national insolvency law. These banks, which comprise 2% and 2.5% of Italian bank deposits and assets respectively, were “restructured” not “resolved”.
Although the European Central Bank declared the banks were likely to fail (37% of the banks’ loans are deemed to be non-performing and deposit outflows approaching 50% had occurred over the prior 2 years) they also declared resolution was not warranted. Therefore, national insolvency rules should apply and it is for the responsible national authorities (in this case the Italians) to wind up the institution under national insolvency law.
The measures involved the sale of a portion of the banks’ businesses to Intesa Sanpaolo, Italy’s largest bank. But, in a significant difference to the Spanish situation, there were cash injections of €4.785 billion by the Italian State and State guarantees of up to €12 billion. Shareholders and subordinated debt holders were again wiped out while depositors were protected. The banks are to be wound up in an orderly fashion while the transferred activities will be restructured and significantly downsized by Intesa.
Under EU State aid rules, shareholders (including Italy’s Atlante Fund) and subordinated bondholders fully contributed to the costs while senior bondholders did not contribute and depositors remained fully protected.
So not only is Spain ranked higher than Italy in the latest FIFA rankings (10th versus 12th) but they seem much more adept at resolving issues within their financial system.
Different Drum
Canso has been a vocal advocate for the establishment of bail-in rules so the financial market can appropriately price the various components of Canadian banks’ capital structures. On June 17th, the Canadian government released proposed Bank Recapitalization Conversion (Bail-In) regulations as part of its response to the Credit Crisis.
The Department of Finance proposed legislation will become part of the Canada Deposit Insurance Corporation (CDIC) Act, making CDIC Canada’s resolution authority. Legislation will apply to Canada’s Domestically Systemically Important Banks (D-SIBs). The proposed regulations would only apply to instruments that were issued, or amended to increase their principal value or extend their term, after the regulations come into force, and are not retroactive. OSFI also released Total Loss Absorbing Capacity guidelines (TLAC) with final legislation expected by year-end 2017 for implementation in 2018.
This Bail-In proposal would:
- Set out the scope of liabilities of D-SIBs that would be eligible for a bail-in conversion (conversion terms if a bail-in were to be executed were left undefined).
- Set out requirements that D-SIBs would have to follow when issuing bail-in eligible securities.
- Set out an updated process for providing compensation to shareholders and creditors of CDIC federal member institutions if they are made worse off as a result of CDIC’s actions to resolve the institution (including through bail-in) than they would have been if the institution were liquidated.
According to the Department of Finance, “the purpose of the bail-in is to recapitalize the institution, and to ensure that the relative creditor hierarchy is respected (i.e. that holders of more senior instruments should be better off than holders of more junior instruments…”).
We continue to be amazed that Canadian bureaucrats, regulators and politicians believe shareholders and junior creditors should be converted as opposed to wiped out in a resolution scenario. Canso has called for the adoption of an “absolute” creditor hierarchy approach which implies completely writing off (i.e., not simply converting into common shares) all subordinate ranking claims (e.g., shares and subordinated debt) before converting any senior bail-in eligible instruments. Why don’t they listen?
Armageddon
Elsewhere in financial markets, Home Capital stumbled badly once the OSC disclosed an ongoing investigation. Warren Buffett eventually rode to the rescue.
The rapid fall and rise of Home Capital exposed some warts in Canada’s financial system, which since the Credit Crisis has been viewed in the highest regard by the international community. To recap the chain of events:
- April 19th: The company confirmed the Ontario Securities Commission intended to pursue proceedings against Home Capital and three individuals including two former CEOs and the current CFO.
- April 27th: The company secured a $2 billion secured credit line, led by HOOPP.
- May 5th: Home Capital stock bottomed at $5.85.
- June 21st: Warren Buffett struck a deal with Home Capital to inject $400mm in equity in two tranches at an average share price of $10 for approximately 40% of the business and to re-finance the $2bn credit facility with one of his own.
Home Capital had been a highflying lender in Canada’s once booming residential real estate market.
Double Secret Probation
The rapid fall of Home Capital, fueled by among other things inadequate disclosure by both the company and regulators, caused investors both emotional and financial grief and trauma. As part of our investigation into goings-on at Home Capital, we drilled down on the policies of the Canada Deposit Insurance Corporation. As of April 2016, CDIC counted 100 Member institutions representing $741 billion of insured deposits. Each institution is classified into one of four premium categories with 1 being the best and 4 the weakest.
Premium rates paid by each member are based on member institutions’ deposits as of April 30th of each year – payable quarterly. It would seem even if a member institution’s insured deposits fall during the year, their premiums may not change until measurement at April 30th of the following year.
Importantly, we learned that neither CDIC nor the member institution can disclose its risk category, the premium rate assigned and a range of other information surrounding these two topics. We ask what good is a warning system if it never warns anyone? Assuming Home Capital was one of three Category 4 institutions, we believe it would have been useful for the investing public to be aware of this.
I See a Bad Moon Rising (and Repeat)
We’ve written at length about the dangers present in the leveraged loan market. The market’s promoters tout the loans’ floating rate coupons (“defensive in a rising rate environment!”), secured position in the capital structure (“great if the company goes belly up!”) and yield (“Libor +250bps is irresistible versus a 2 year treasury at 1.30%!”).
Snake oil by any other name is still snake oil in our books. Read the fine print and the warning signs are many. Weaker covenants, higher tolerances for 1st lien leverage and tight pricing. All of this in a market dominated by fund flows into (and eventually out of) CLO’s and ETF’s. It is estimated CLO’s and ETF’s account for upwards of 60 – 70% of leveraged loan purchases.
At Canso, the key drivers of our bottom up fundamental credit process are the answers to the following four questions.
- Is the company going to pay us back at maturity? (i.e. business fundamentals)
- What remedies do we have if the company cannot fully pay us back? (i.e. covenants)
- How much will we lose if the company does not pay us back in full? (i.e. structure)
- Are we being compensated for the risk that the company doesn’t pay us back in full? (i.e. pricing)
What questions does the CLO manager ask prior to purchase? None of Canso’s questions, we can assure you of that. The key driver for the CLO manager is whether the loan fills an industry, a credit rating or a geographic bucket on his spreadsheet to provide the diversification required to market the CLO.
To make matters worse, recent rumours from Washington suggest a relaxation of financial services regulation including potential changes to the definition of leveraged loans. These changes would allow banks to be more aggressive in the structuring of leveraged loans. Add that to the participation in the markets by sponsors including KKR and we see leverage tolerances going higher not lower.
Given these trends, it is not surprising that a recent report by Fitch Investors Service noted the following: 67% of outstanding broadly syndicated loans are in covenant-lite format. Fitch also estimates a 2.5% default rate for 2017 (dominated by Energy 18% and retail 9%) versus 1.8% for 2016 and noted post-default prices are falling to 46.2% for 2016, versus 2015’s 49.9% and 76.3% in 2014.
And why all the fuss? All this additional risk for very modest returns. The S&P/LSTA U.S. Leveraged Loan Index YTD return is a modest 2.0%. Not to be cynical, but we suspect the fees paid to the average CLO manager are quite attractive (returns be damned).
We prefer to watch this mania from the sidelines. If and when the market corrects, we expect to be there to pick up some of the pieces at what we expect to be very attractive prices.
TNT
An explosive material? Tanya Tucker’s breakthrough album? Rock anthem by legends AC/DC? All reasonable guesses. However, viewed through today’s sobering lens, TNT is an acronym for what ails the world and overhangs the financial markets – Terrorism, North Korea and Trump. It is our expectation that these threats to the safety, stability and sanity of the world are unfortunately all with us for the foreseeable future. So with that said…
Where Do We Go From Here?
Canso continues its bottom up fundamental analysis of securities issued by companies around the world. Only some of these securities will find their way into our Canso portfolios, if their potential return compensates for their risk. A number of our purchases during the Credit and Euro Debt crises have matured or been called over the last 12 months. As we reinvest the proceeds of these called and matured bonds, we are finding better value in higher quality issues and have become more conservative in our portfolios. Although administered and market traded interest rates are higher than 12 months ago, we continue to see value in floating rate notes. This makes us well positioned to take advantage of opportunities when they arise.
O’Canada
Those who know Canso know we are strong supporters of the Canadian military and its heritage through organizations including the Royal Military College of Canada, True Patriot Love and The Vimy Foundation.
In this the year of Canada’s 150th birthday, we ask you to pause for a moment (or several moments) to give thanks and thought to the following. Nearly two million men and women through Canada’s history have donned the uniform to protect the freedom we all enjoy today. 115,954 of those paid the ultimate price. The numbers are staggering.
Today 70,000 men and women serve in the Canadian Army, Navy and Air Force and an additional 700,000 Canadian veterans live amongst us. So if you happen to see someone in uniform don’t hesitate to thank him or her for their service. We owe all of them, past and present, a great deal. It is incumbent on all of us to remember them
