Pardon our editorial tardiness, for many of us have been away in France for the Vimy100 commemorations.
Where Canada Came of Age
April 9th, 2017 was the 100th anniversary of the Battle of Vimy Ridge, which was a major victory for the Canadian Expeditionary Force in the First World War. It was the first time Canadians fought as a national formation, the Canadian Corps. Its success in taking the strongly defended and fortified Vimy Ridge from the entrenched German Army was one of the few bright spots for the Allied armies in what had become a grinding and bloody war of attrition. Canada was only 50 years old in 1917 and many point to the Battle of Vimy Ridge as the day Canada “came of age”, becoming a nation in its own right.
The French and British armies had previously sustained massive casualties in failed attempts at taking Vimy Ridge. It was the high point dominating the surrounding landscape and was key to the German defence line. The Canadian success was front-page news, with a New York Times headline trumpeting the Canadian victory. The Canadian Corps then went on to become the elite assault force for the Allied armies and was the spearhead of the “100 Days” campaign that finally led to the German surrender in November 1918.
Canso Investment Counsel and our affiliate Lysander Funds were major donors, through the Vimy Foundation, to the new Visitor Education Centre at the Canadian National Vimy Memorial in France. The Vimy Memorial, portrayed on the reverse side of the current Canadian twenty-dollar bill, was chosen by a national competition in 1921. It was designed by Canadian sculptor Walter Allward and built on the actual site of the Battle of Vimy Ridge, on land deeded in perpetuity by France. The names of Canadian war dead with no known grave are listed on the monument. King Edward VIII formally unveiled the memorial in a 1936 ceremony attended by many Canadian veterans and their families in what was called their “Vimy Pilgrimage”.
The recent Vimy100 commemorations were broadcast live by the CBC. Their Royal Highnesses The Prince of Wales, the Duke of Cambridge, and Prince Harry along with Governor General David Johnston, Prime Minister Trudeau, and President Hollande of France were among the dignitaries in attendance. The ceremony was very moving and the attendance was estimated at 25,000, mostly Canadians. Many veterans and high school students were in the crowd.
We highly recommend a visit to the Vimy Memorial. It is an emotional experience for Canadians to visit this beautiful monument, to see the preserved battlefield and consider the huge sacrifice of our First World War soldiers. The new Visitor Education Centre is a wonderful addition to the site and we were proud to be part of this project and the Vimy100 commemorations.
Back to Business
It was an interesting experience to be immersed in history and sacrifice and then return to the day-to-day of the financial markets. The Vimy Memorial itself was conceived in the “Roaring Twenties” but was completed in the midst of the economic devastation of the Great Depression.
We couldn’t help but think of the soldiers who returned to civilian life after spending 5 years in military service. Much had passed them by from the start of the war in September 1914 until its end in November 1918. The massive task of demobilization meant that many returning soldiers were not sent home until well into 1919. A short ten years later they were suffering through the economic and social agony of the Great Depression.
Parallel History
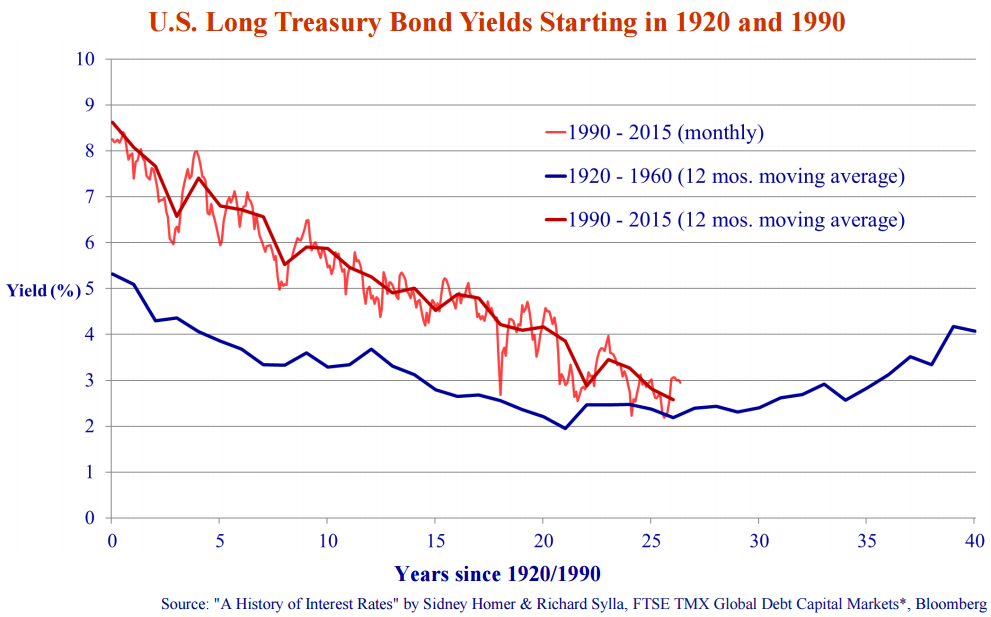
We have talked in our previous newsletters of the similarity between the period of the 40 years from 1920 to 1960 and the current period starting in 1990, which we are now 27 years into. The end of World War One saw massive numbers of soldiers return to the civilian workforce and the conversion of war factories into civilian production. The First World War saw a jump in large scale manufacturing to meet war demands. Canada and many other countries vastly increased their manufacturing capacity, in both plant and human capital. We observed that this was comparable to the end of the Cold War in 1989. This saw the entry of the Soviet block and China into the global economy and the subsequent diversion of manpower and productive capacity from the Cold War militaries to civilian usage.
We grant that no historical parallel is exact but we think our grandparents’ experience is instructive. We came across this interesting comparison while thinking about the very low interest rates of our current period and considering the experience of the Great Depression. Updating our chart from our January Market Observer (see below), we point out that the similarity in the pattern of bond yields is continuing.
U.S. Long Treasury Bond yields bottomed over the 5 years from 1941 to 1946, from 21 to 26 years after the start of the period from 1920. The current bottoming in Long T-Bond yields is very similar. We seem to have been bouncing around the yield lows since 2012, 22 years after the recent period started in 1990. We find it interesting that 2017, 5 years since 2012 and 27 years since 1990, seems to be a year of rising bond yields.
Moving Sideways
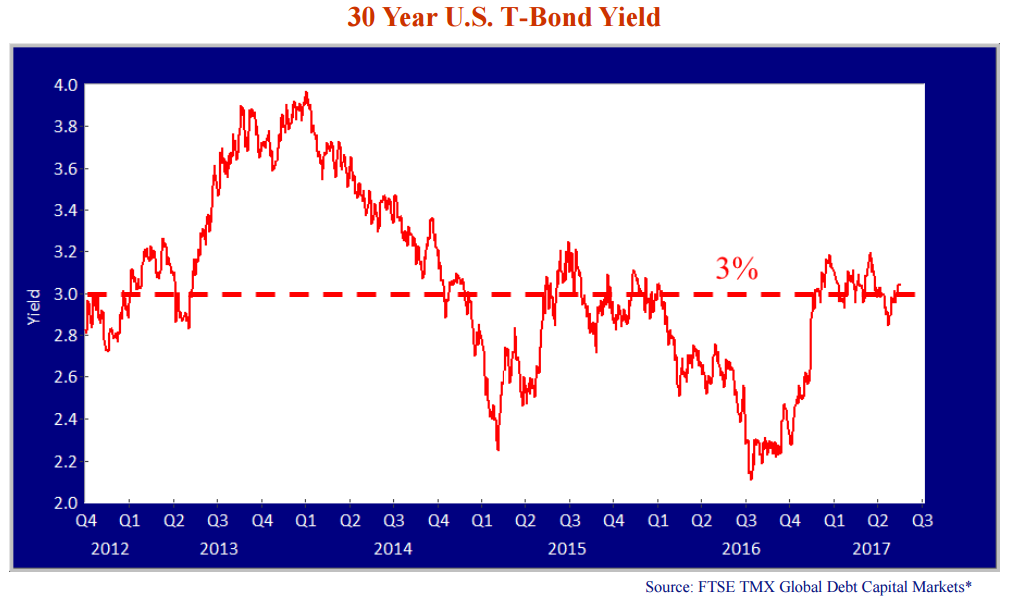
The chart below of the U.S. 30 Year T-Bond yield confirms that it has been essentially moving sideways for the 5 years since 2012. It looks to us like the low 30 Year T-Bond yield since the peak in 1981 will be the 2.18% recorded on July 1st, 2016, during the post Brexit fears.
The current 30 Year T-Bond yields 3.04% in May 2017, as per the chart below. It is a little down from the recent peak of 3.07% at the start of 2017, as confidence in the Trump economic miracle abated. We are not economists and we hesitate to make rate predictions but we are still confident that we are in a period of bottoming yields. It could be a 5 year period like 1942 to 1947 or it might take longer before yields can be said to be in a definite uptrend. In any event, we still think that there is much more upside in yields than downside and investors should be wary of locking in yields at what could be generational lows.
Is there enough economic calamity to justify today’s extraordinary monetary policy and interest rates? NO! Donald Trump and his voters definitely thought so but the reality is very different. As we have told you before, the U.S. economy has been plodding upwards for some time with bond investors none the wiser. A recent New York Times article says it all:
“Jobless Rate at 10-Year Low as Hiring Grows and Wages Rise…
The jobless rate dropped to 4.4 percent in April, the lowest level in more than a decade, the government said on Friday, signaling the economy’s resilience and showing a labor market closing in on full capacity.”
An Unreserved Fed?
Even the Federal Reserve is taking note, keeping language about further interest rate hikes in 2017 in its May statement, looking through some recent economic weakness and focusing on the job market. With the job market doing well and labour shortages being reported, we are finally seeing the growth in wages one might expect. The justification for low interest rates is becoming less and less rational and more and more wishful thinking.
Spreading the Currency Pain
Governor Poloz and the Bank of Canada are still in the denial stage and are desperately seeking any justification for keeping interest rates low. The Canadian bond market is along for the ride, keeping yields low compared to its American cousin. Perhaps Poloz is just as terrified of the Canadian housing market as we are and fears that higher mortgage rates could burst this bubble.
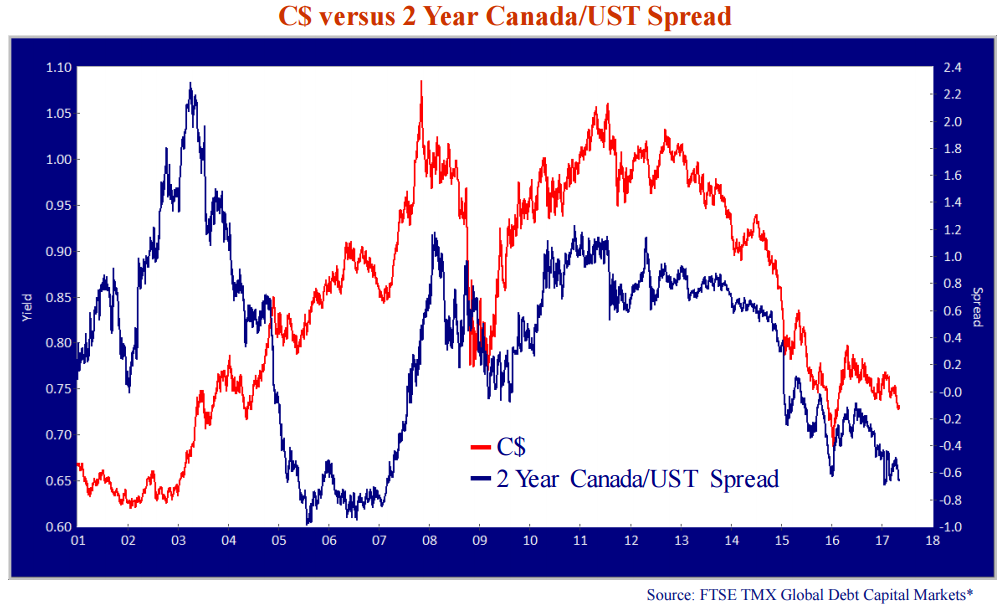
The problem for Mr. Poloz is that the Canadian dollar moves in sympathy with the yield spread between Canadas and U.S. T-Bonds. Canadian bonds have historically traded at higher yields than U.S. bonds, reflecting the relative size and quality of the two economies. The chart below shows the C$ (red line) plotted against the 2 year Canada/ UST spread (blue line). In the period of currency weakness during the recession and commodity bust from 2000 to 2003, the spread rose to +2.3% in defence of the C$. From 2003 to 2007, during the commodity boom, the spread fell to -.8% to keep the Canadian economy competitive. Today’s Canadian bond yields are again much lower than U.S. yields but we have been in a commodity bust, not a boom. Yes, Canada rode out the Credit Crisis much better than other countries but should probably still trade back of U.S. bond yields, considering the Trudeau government inclination towards deficits.
There is considerable currency risk in allowing Canadian yields to slip much farther under U.S. yields. The chart on the previous page shows clearly that the C$ has tracked the 2 year spread fairly closely since 2007. The 2 Year Canada currently trades at a -.65% spread below the 2 Year T-Bond yield. In January 2016, this spread was -.63% and the Canadian dollar was in free fall, approaching .70 US$ after falling from .79 US$ a mere year before and well off its peak of 1.06 US$ in 2011. While Mr. Poloz wanted a weaker C$, politicians and voters took note. Perhaps it was the email circulating of the Canadian Peso with Prime Minister Trudeau in a Sombrero but Poloz dropped his messaging of further interest rate declines and the bond market responded. The 2 year Canada/US spread shrunk to -.09% and the C$ rose to .80 US$. It is not chance that the Canada/U.S. spread is getting much more negative and the C$ has fallen to .73 US$.
Taking Stock
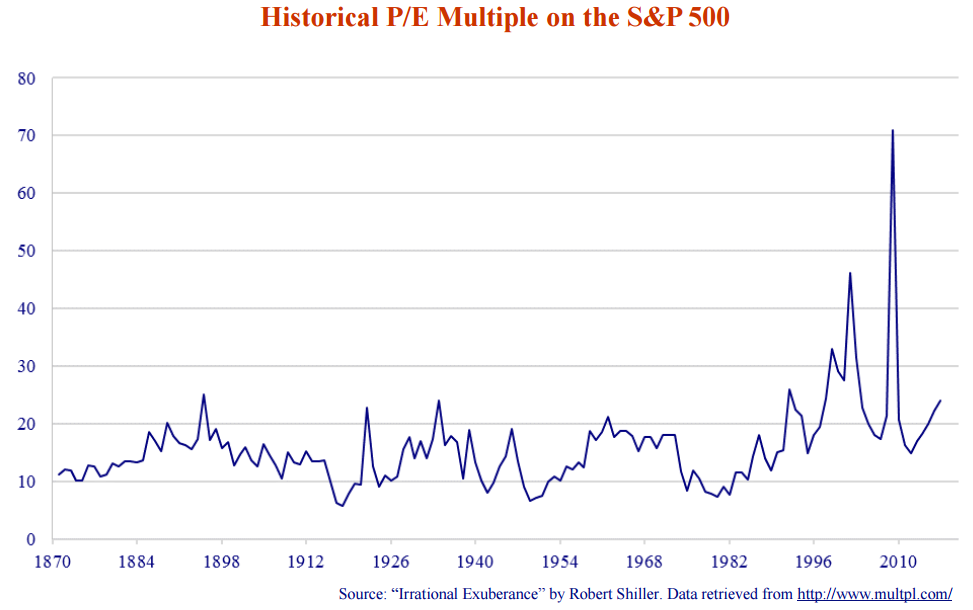
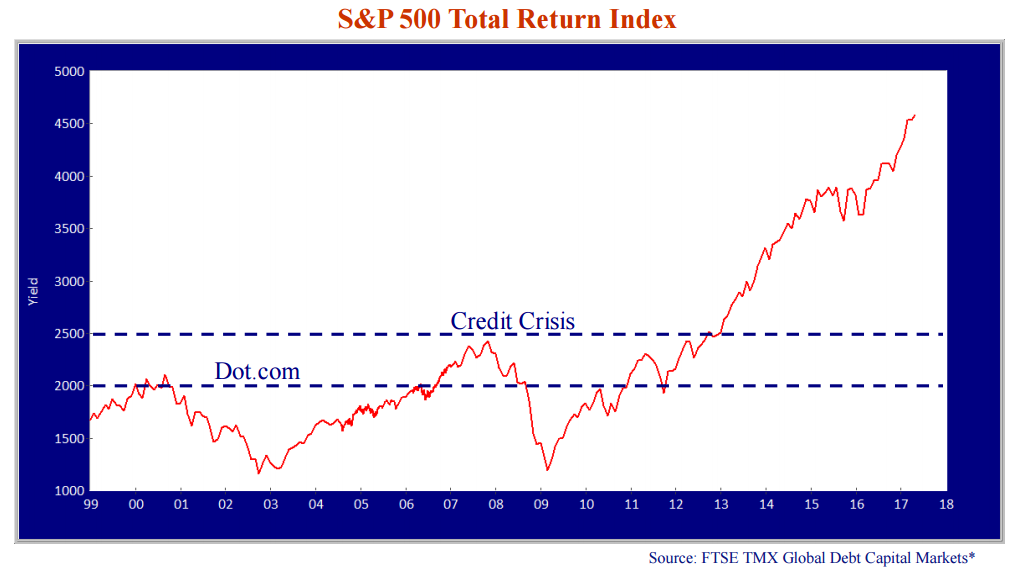
Given our fears of an overvalued bond market, what about the fears of an overvalued stock market? The chart above shows the level of the S&P 500 equity index and is some cause for concern. Using data from professor Robert J. Shiller of Yale University, it shows that at a current estimated trailing Price/ Earnings (P/E) ratio of 25.2, the S&P is well above the long-term historical average P/E of 15.7x.
In the 5 years since 2012 that the yield of the 30 Year T-Bond has essentially gone sideways the chart of the S&P 500 on the following page shows it nearly doubling over the same time period. This could indicate overvaluation, since the bond yield portion of the equity discount rate has barely budged. The annual earnings of the S&P only increased 3.9% from 2012 to 2016 and have not caught up while the P/E of the S&P increased 49% in the same period, from 14.9x to 22.2x.
Going back farther, the increase in the S&P from 2013 to present followed a long period of stagnation that started during the dot.com sell off in 2000. The 1498 index level at December 31, 2013 was still below the August 2000 dot.com peak of 1518 and the September 2008 pre-Credit Crisis peak of 1549.
Falling earnings due to economic recession led to very high P/Es of 46.2x in 2002 and 58.2x in 2009. The current P/E is above the 21.5x in January 2008, in the lead up to the Credit Crisis, but still below the 24.3x of January 1998, 32.9x of January 1999 and 29.6x of January 2000, all preceding the dot.com market downturn. We are certainly getting into pricey territory and earnings would need to increase to lower the ratio to more reasonable historical levels.
It is fascinating that the enthusiasm for stocks after 2013, reflecting an improving economy, did not spill over into the bond market. Normally yields would increase with an improving economy but they have stayed at crisis lows, reflecting extraordinarily accommodative monetary policy. Geopolitical and economic terror sent yields to generational lows during successive market panics as we saw the Euro debt crisis, Greece, the commodity rout and Brexit to name a few.
The stock market was in a sweet spot after 2013, with economic and earnings growth combining with extraordinarily low bond yields and low equity discount rates. Equities were very attractive to investors in comparison to paltry bond yields.
Trumptastic Tax Cuts
The high P/Es of the equity markets might be picking up the Trump administration’s proposed and substantial corporate tax reductions. This would increase after-tax profits substantially and could be impounded in the current P/E. For example, if the U.S. corporate tax rate drops from 35% to the proposed 15% the increase in after-tax earnings would be from 65% of pre-tax earnings to 85%, an increase of 31%. If the discount rate stays the same in a cash flow discount model, the stock price should increase 31%.
This simplistic analysis is complicated by the fact that most U.S. corporations do not pay the official or statutory rate due to tax avoidance strategies, i.e. routing earnings to foreign subsidiaries through inter-company loans and payments for royalties and/or intellectual property. On the other hand, there are many U.S. companies that do not have complicated tax avoidance structures and probably would have a substantial increase in after tax earnings distributable to shareholders.
Stratospheric Bonds
The stock market is trending to the expensive end of things but it is bond prices that are truly stratospheric on a relative basis. The 3% yield of the 30-year U.S. T-Bond is a 33.3x P/E ratio (=100/3), with no prospect of any earnings increase. This compares to a lower 25.2x P/E on the S&P 500. This puts bond valuations very high compared to stocks. The 2000 pre-dot.com crash P/E of 29.6x compared to a Bond P/E of 15.4x, about half of the stock P/E.
If you prefer the Earnings Yield, earnings divided by price (E/P the inverse of the P/E ratio), today’s P/E of 25.2x translates into a 3.9% E/P on the S&P 500. This is .9% higher than the long T-Bond yield of 3.0%. The pre dot.com E/P of 3.3% compared to the much higher 6.5% long T-Bond yield at that time. A stock investor in 2000 gave up 3.2% (=6.5-3.3%) in yield versus a bond where today’s stock investor actually has an earnings yield .9% higher than what she could get from a long T-Bond.
Since the stock investor has the potential for earnings to increase, the 3.9% earnings yield will increase over time. We think this calculus is what is encouraging stock investment. Rising bond yields would increase the stock discount rate which should lower stock prices but bonds are very exposed as well, with little offset from rising cash flows.
Interesting Rates
Rising bond yields will also not be good for real estate values, neither commercial nor residential. As our faithful clients and readers know, we have been cautious on Canadian residential real estate for some time. We thought it was fundamentally overvalued in the summer of 2013 when we wrote our Canso Px on the subject. Our view on any speculative and credit driven asset market is that prices will eventually outstrip the availability of credit and the subsequent sell off will be severe.
As we tell people, it takes a long time for things to move to their intrinsic value and this has certainly been the case with Canadian residential real estate. We have been quite obviously wrong for the last 4 years, but in our defence we said that the residential real estate market is tightly linked to interest rates. The 5-year Canada bond yield dropped from 1.7% on July 1st, 2013 to its low of .6% on July 1st, 2016. It is now at .97%.
Interest Ratings
The 1.1% decline in the 5-year Canada yield from 2013 until now fed into the mortgage market. The posted rate of the RBC fell from 5.1% on July 1, 2013 to 4.7% on July 1st, 2016 which saw the low Canada yield of .6%. The current RBC posted 5-year mortgage rate is still 4.7% although 5-year Canada bond yields are up .4%. Banks typically discount substantially from their posted rate and the current RBC “Special Offer” 5-year mortgage rate is 2.7%. Smaller institutions offer lower rates than the major banks to compete and the lowest current rate of 2.3% on ratehub.com is .4% lower than the major banks.
Interestingly, banks typically try to maintain a Net Interest Margin (NIM), the difference between their lending and funding rate, greater than 2%. At the current 2.7% 5-year mortgage rate offered by RBC and their 5-year GIC rate of 1.6%, their lending spread or NIM is only 1.1% (=2.7-1.6), which shows the competitiveness in the Canadian mortgage market.
Home Alone
The current 5-year GIC rate on ratehub.ca from minor players Tangerine, PC Financial and State Bank of India is 2.0%. What is striking is that this is much lower than the best rate, 2.5% from Oaken Financial. Oaken is the CDIC-insured funding brand for the Home Capital Group (HCG), primarily a mortgage lender. HCG has some very public problems with mortgage underwriting fraud and governance and is trying to stem a deposit and GIC withdrawal run. While the 2.5% seems high for a CDIC insured GIC, it is dwarfed by the 10% on an emergency loan that HCG obtained from institutional investor HOOPP that, with a $100 million fee, has been estimated at a 22.5% effective interest rate.
Clearly the problems at HCG are serious since they are paying an exorbitant fee and interest rate to get this funding. To recap, HCG revealed last year that their underwriting of insured mortgages from a group of mortgage brokers had fraudulent income data. HCG cut off these mortgage brokers who had done significant volume and this resulted in a sizeable drop in their mortgage originations. An Ontario Securities Commission (OSC) investigation resulted in charges that HCG and its senior officers did not properly disclose the mortgage fraud in a timely manner, knowing of the problem far in advance of their eventual public disclosure. The OSC also allege that senior management purposely downplayed the fraud and misled investors about the drop in their mortgage underwriting volumes.
The OSC charges created a crisis of confidence in HCG. Fraud and management deception are never selling points for a financial institution. Several major financial institutions have now restricted their clients from investing in HCG savings products. HCG needed the emergency financing loan to replace a severe drop in their deposits and GICs as nervous clients and their financial advisors cashed in or did not roll their investments. HCG’s stock has fallen from $26 on March 31st to the current $9.52, a drop of 63%, as their problems compounded.
In the interest of full disclosure, several of Canso’s investment funds have had short positions in HCG stock for some time.
We are not happy about the problems at HCG, despite the validation of our view on the Canadian housing market and our comments on the widespread fraud in the Canadian mortgage market. Many Canadians will be hurt by their ill-timed and speculative bets on the housing market. As we said in our 2013 Housing Px, “We hope very much to be proven wrong, but the analysis is clear.” The spectacular rise in asset prices during a credit bubble, as investors rush to buy, is usually followed by a violent downturn in the very same prices, as anxious creditors force speculators into liquidation and buyers disappear.
Speculation Versus Ownership
There is a huge difference between a housing market that supplies shelter and one that facilitates speculation. It seems to us that the Canadian housing market has developed into a “pump and dump” stock speculation scheme. Regulators are unable or unwilling to bring themselves to look into the dark corners of this market, probably for fear they might find something that would reflect badly on them.
The Home Capital situation was not surprising to us. We have been told by several market sources that people offering fake income documentation for mortgage applicants have set up at gatherings of mortgage brokers. They offer employer letterhead for income verification letters and telephone call centres for verification calls. Clearly, the fraud at HCG is not isolated.
While researching our Housing Px in 2013, a mortgage broker told us that he had lost a mortgage deal to another broker who had faked incomes for the applicant. He complained to the major chartered bank that provided this insured mortgage as well as CMHC, OSFI, Canadian Mortgage Brokers Association and the Financial Services Commission of Ontario about this case of income fraud and none of these organizations was moved to action. To our knowledge, the mortgage brokers who were cut off from Home Capital for faking incomes in applications have not been disciplined by any of the regulators or their professional association.
A Flipping Frenzy
Our concerns with fraud, money laundering, tax avoidance and speculation have all been borne out. A recent Globe and Mail investigative article, Investigation: Inside the flipping frenzy at Toronto’s X2 condo is a litany of speculations. The reporters researched all the transactions at this Toronto building from pre-construction to the present and made the following conclusion:
“The Globe and Mail examined more than 1,000 transactions in the building, from preconstruction sales to rental offerings, to understand the economics behind condo flipping. The results reveal the potential for lucrative gains – almost $500 a day, on average – and support analysts’ concerns that investors and speculators are buying and selling condos just like stocks, driving up prices, crowding out first-time buyers and creating unstable rental housing.”
Many of the speculators are housing professionals, as we said in our Housing Px. The Globe interviewed Susan Tavana, a mortgage broker, one of the investor/speculators who owns and rents a unit in the building:
“Ms. Tavana is now selling her unit for $699,000 and is hoping for a six-figure profit. The suite, which she bought in 2013, was her fourth in a total of eight downtown condo purchases. In all, she now owns four units, two of which are for sale; she has also bought two others that haven’t been built yet.”
Ms. Tavana now owns four units, two for sale and has committed to two others pre-construction. Her income and condo “investments” are totally dependent on the real estate market staying strong. If the market weakens, her income and her condo prices will drop in tandem. The speculation is not confined to the condo market. The same thing is happening with suburban real estate developments and existing housing developments. Speculators, many real estate agents and mortgage brokers, are putting deposits on houses in new subdivisions and then selling their contracts or selling the house once it is built. The U.S. housing meltdown also saw many new subdivisions owned primarily by speculators who were wiped out when the bubble burst. Many of these flippers are not reporting the income they make on these transactions to CRA, which is tax fraud and a criminal offence. The recent requirement for house sales to be listed on annual tax filings makes non-reporting a much more dangerous pastime.
Frightening Tightening
Many of our clients are asking if Home Capital will be the contagion that sinks the housing market. Not directly. The problems at HCG are not with defaults, as in the U.S. real estate meltdown, but with underwriting fraud. It is notable that the fraud occurred on mortgages that were insured and ultimately backstopped by the Canadian Federal Government. HCG management implied on a conference call last year after the income fraud was exposed that their underwriting standards required higher documentation for their non-insured mortgages. They also said that if the letterhead looked authentic for income documentation on an insured mortgage, that it was good enough for them!
What will it take for the bubble to burst? Since a massive housing credit expansion has fuelled the housing boom, it will take a reduction in available credit for a housing bust. The pendulum is now swinging towards tightening mortgage credit. We think the HCG imbroglio will tighten mortgage underwriting standards.
Missives from On High
Regulators did not detect the HCG fraud; it was only exposed after a complaint to the HCG Board of Directors. There’s nothing like a stock meltdown and legal charges levelled against officers and directors to get the attention of other financial institution senior executives. Missives from on high at the major banks will be asking the mortgage division about their underwriting standards. Whistle blowers will be empowered and compliance and audit committees will be on high alert. Now it is in the press, even the “see no evil” regulators will also be forced to confront the rampant fraud.
The review of audit and compliance committees will flow down the management organization chart. The mortgage supervisors who turned a blind eye to the sketchy underwriting of their top producers will now put continued employment ahead of bigger bonuses. Mortgage brokers and bank mobile mortgage representatives will themselves see the danger in fraudulent applications. This will all tighten mortgage credit. Non-bank credit funding should also tighten, as the Mom and Pop investors who chased yield into the second and third mortgage markets start to wonder about the safety of their investments. Many probably do not realize that if the borrower cannot refinance, they won’t be getting their money back.
Stupid Is as Stupid Invests
The bond market is also experiencing speculation by investors chasing returns. There’s nothing like the prospect of a bit higher yield to induce a gullible bond investor to take on a lot of risk. As we’ve said before in Gumpian (as in Forrest), “Stupid is as Stupid Invests”. We are shocked by the procession of recent below investment grade deals in the Bank Loan and High Yield markets that feature coupons in the 4-5% range and even lower.
One of our earliest and most profitable Canso observations is that as flows into high yield mutual funds increase, the portfolio managers of these funds have to invest no matter what sort of credit detritus is on offer. This is why we have always refused to manage dedicated high yield mandates and prefer to invest when valuations are attractive. If things are overvalued, we prefer security quality to yield quantity.
The New, New Credit Thing
Our current credit world features passive high yield portfolio management, which is a whole new level of financial idiocy. To us, the idea of a passive high yield investment fund smacks of gross negligence: “lend the most to whoever borrows the most” is not the best lending strategy but this is what an indexed credit fund does! This cycle is made worse by the slavish and inane worship of “passive, liquid and low fee” ETFs which borders on investment insanity. Adding insult to investment intelligence is the claim of liquidity for an ETF invested in illiquid underlying assets such as junk bonds and bank loans. This borders on delusional but is now portrayed as investment genius.
At this stage in the high yield market, there is much to fear and little to recommend, other than the thought there is a greater fool out there who will buy. As we have repeated many times on these pages, we do not believe in high yield and bank loans as asset classes. At market tops, money rushes in and fools invest.
May the Inflows Be With You???
And what do the experts have to say? The BAML fixed income research team put out a High Yield Flow Report entitled “May the inflows be with you”. This cheeky title is worthy of a Canso newsletter and caught our attention. As the wishful BAML analysts said:
…the lack of inflows to mutual funds this year has been surprising given the nearly 4% return high yield has experienced to-date. However, we would expect the recent inflows to gain momentum should these strong returns continue, as in our opinion retail investors would eventually begin to chase alpha…”
Loosely translated from the pretentious financial vernacular: “These poor suckers will chase returns and buy anything”.
Yes, we have a strong opinion on the current credit excess. The speculation in high yield and bank loans has gone from the sublime to the ridiculous. Credit market apologists make the case that default rates are low. As we have said before, it is difficult to default when lenders are stuffing you full of money. It is when credit becomes less available that the bad things happen to asset prices and default rates.
We are faced with that most difficult time in our investment cycle, when we are seeing more value in high quality than low quality. We would rather buy a cheap high quality bond than a very expensive below investment grade issue. Picking up a few extra basis points by assuming immense risk is never a good idea. So what are we doing? Exactly what we said in our January 2017 Market Observer:
“At Canso, we are still in our period of improving overall portfolio quality, as our existing positions are called or mature and we replace them with higher quality securities. This sets up our portfolios for the inevitable next buying opportunity”.
Boring but well advised!
