
Sibling Rivalry
Trade tensions between Canada and the United States re-emerged over the summer as efforts to reach a broader trade agreement ultimately broke down. While both sides spent weeks at the bargaining table, discussions stalled over issues ranging from autos and dairy to alcohol and market access. What began as a debate over tariffs evolved into a broader dispute over policies that Canada considers central to its economic sovereignty, cultural interests, and national priorities. Ottawa argued that Washington’s demands would require significant concessions while offering limited tariff relief in return, while the U.S. maintained that existing Canadian policies unfairly disadvantaged American producers. The impasse culminated in the United States imposing new 50% tariffs on a range of Canadian products in August, prompting Canada to respond with dollar-for-dollar counter-tariffs on approximately C$27.6 billion of U.S. imports.1 By quarter-end, relations remained strained with no clear path to a near-term resolution.
More Than a Game
We are also still reminded of the close ties that continue to bind the two nations. The Buffalo Bills opened their season by inviting Canadian artist Barenaked Ladies to perform ‘O Canada’ before kickoff, in what was a fitting tribute to a fan base that extends well beyond Western New York and deep into Canada. The Bills have long enjoyed a loyal Canadian following, with generations of fans making the trip across the border to Orchard Park on fall Sundays. The moment was met with amazing collective enthusiasm and served as a reminder that the relationship between the two countries remains deeply intertwined, even at a time when politics are testing the partnership. Go Bills!
Don’t Poke the Bear
Beyond gestures of goodwill, the bond market continues to be focused on the consequences of financial and geo-political disruption. The bond bear market has continued to intensify. Over the third quarter, interest rates in Canada and the U.S. increased 50 to 85 basis points (bps) across government yield curves to touch levels last seen at the turn of the century. The increase in borrowing rates is having adverse impacts across consumers, homebuyers, government finances and levered corporate borrowers. Many fear we are in the midst of a secular change, and despite recent respite, there is more pain yet to come.
Over the past 150 years, secular bull-bond markets and bear-bond markets tend to be measured not in years, but decades. This is illustrated in the graph of long-term U.S. interest rates below. The bond bull market that ran from 1981 to 2020 saw U.S. rates fall from 15% to 1%, providing a significant benefit to fixed income investor portfolios.
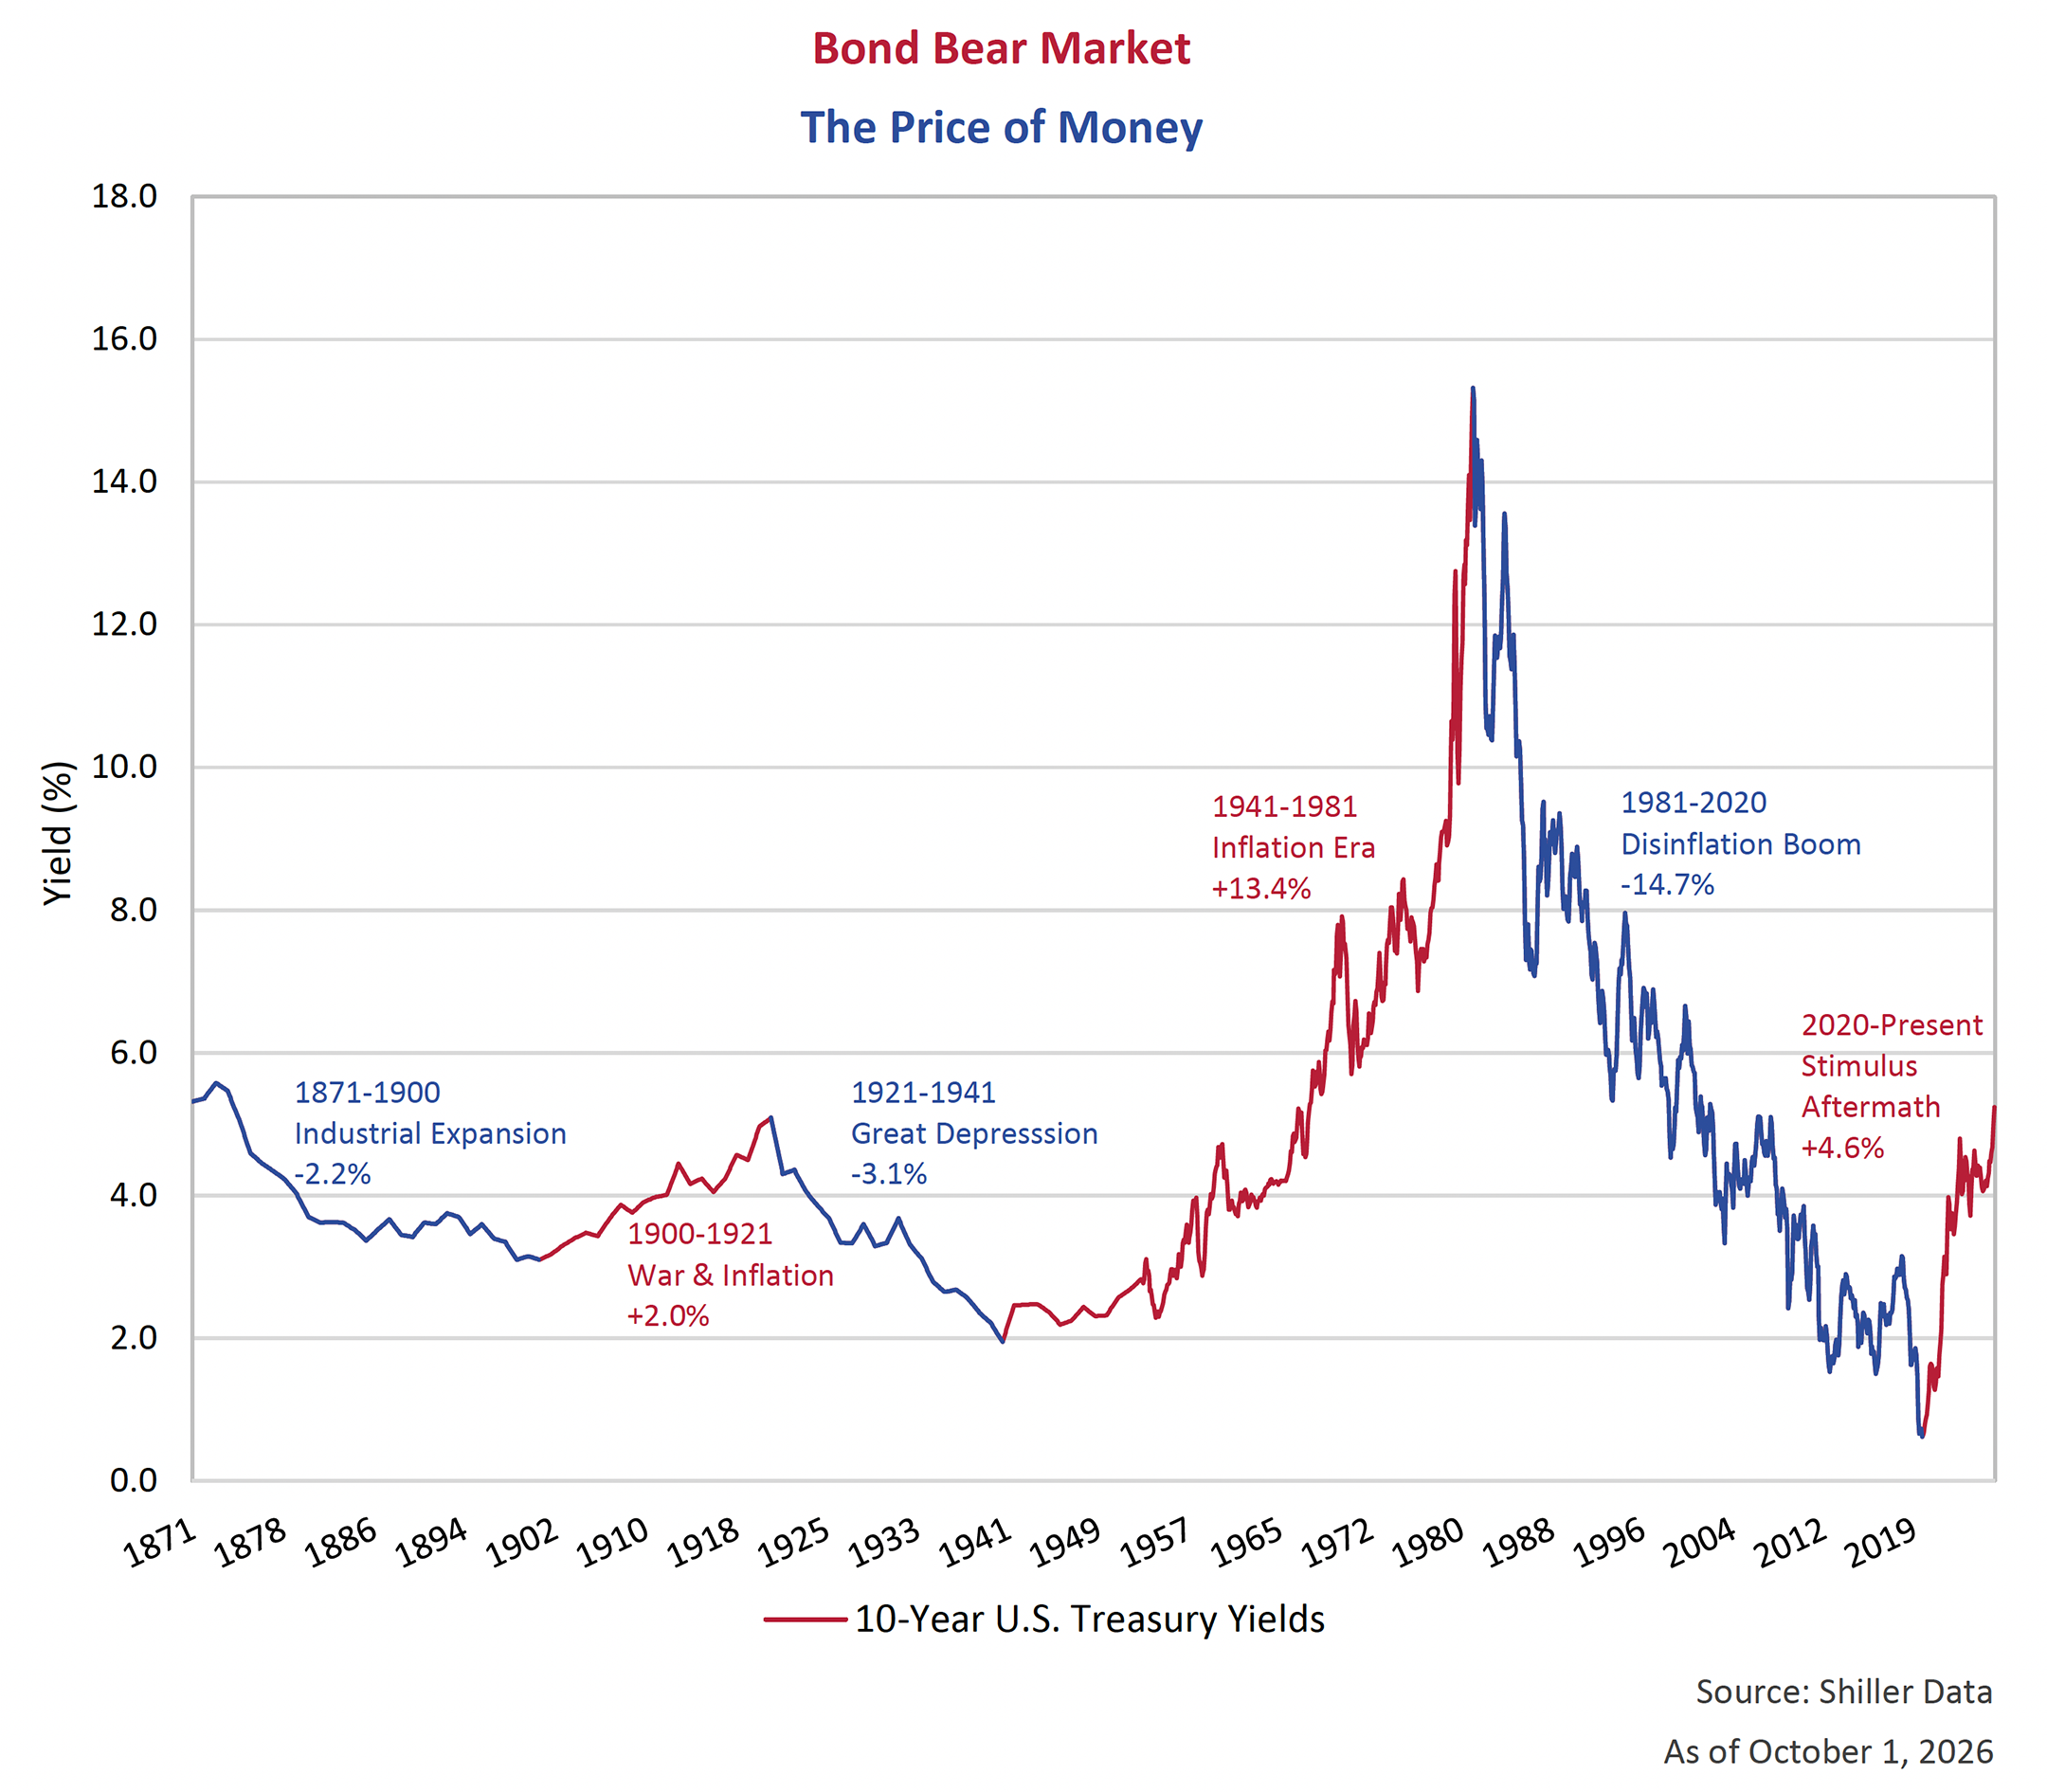
Since 2020, rates have risen off the Zero Interest Rate Policy (ZIRP) floor and trended steadily higher. The current reversal has sent rates back above 5%. Whether rates continue to trend higher over the next decade is any crystal-ball gazer’s guess, but it is not hard to argue that bonds are in bear market territory.
Managing Expectations
What may be surprising for readers is that there has not been a measurable rise in longer term inflation expectations. We are in the midst of an energy shock sparked by two destructive wars and governments are spending with fewer guardrails and no austerity in sight. Headline inflation in the U.S. has been above 2% for the past 66 months. Despite this, inflation expectations have remained orderly over the past 5 years.
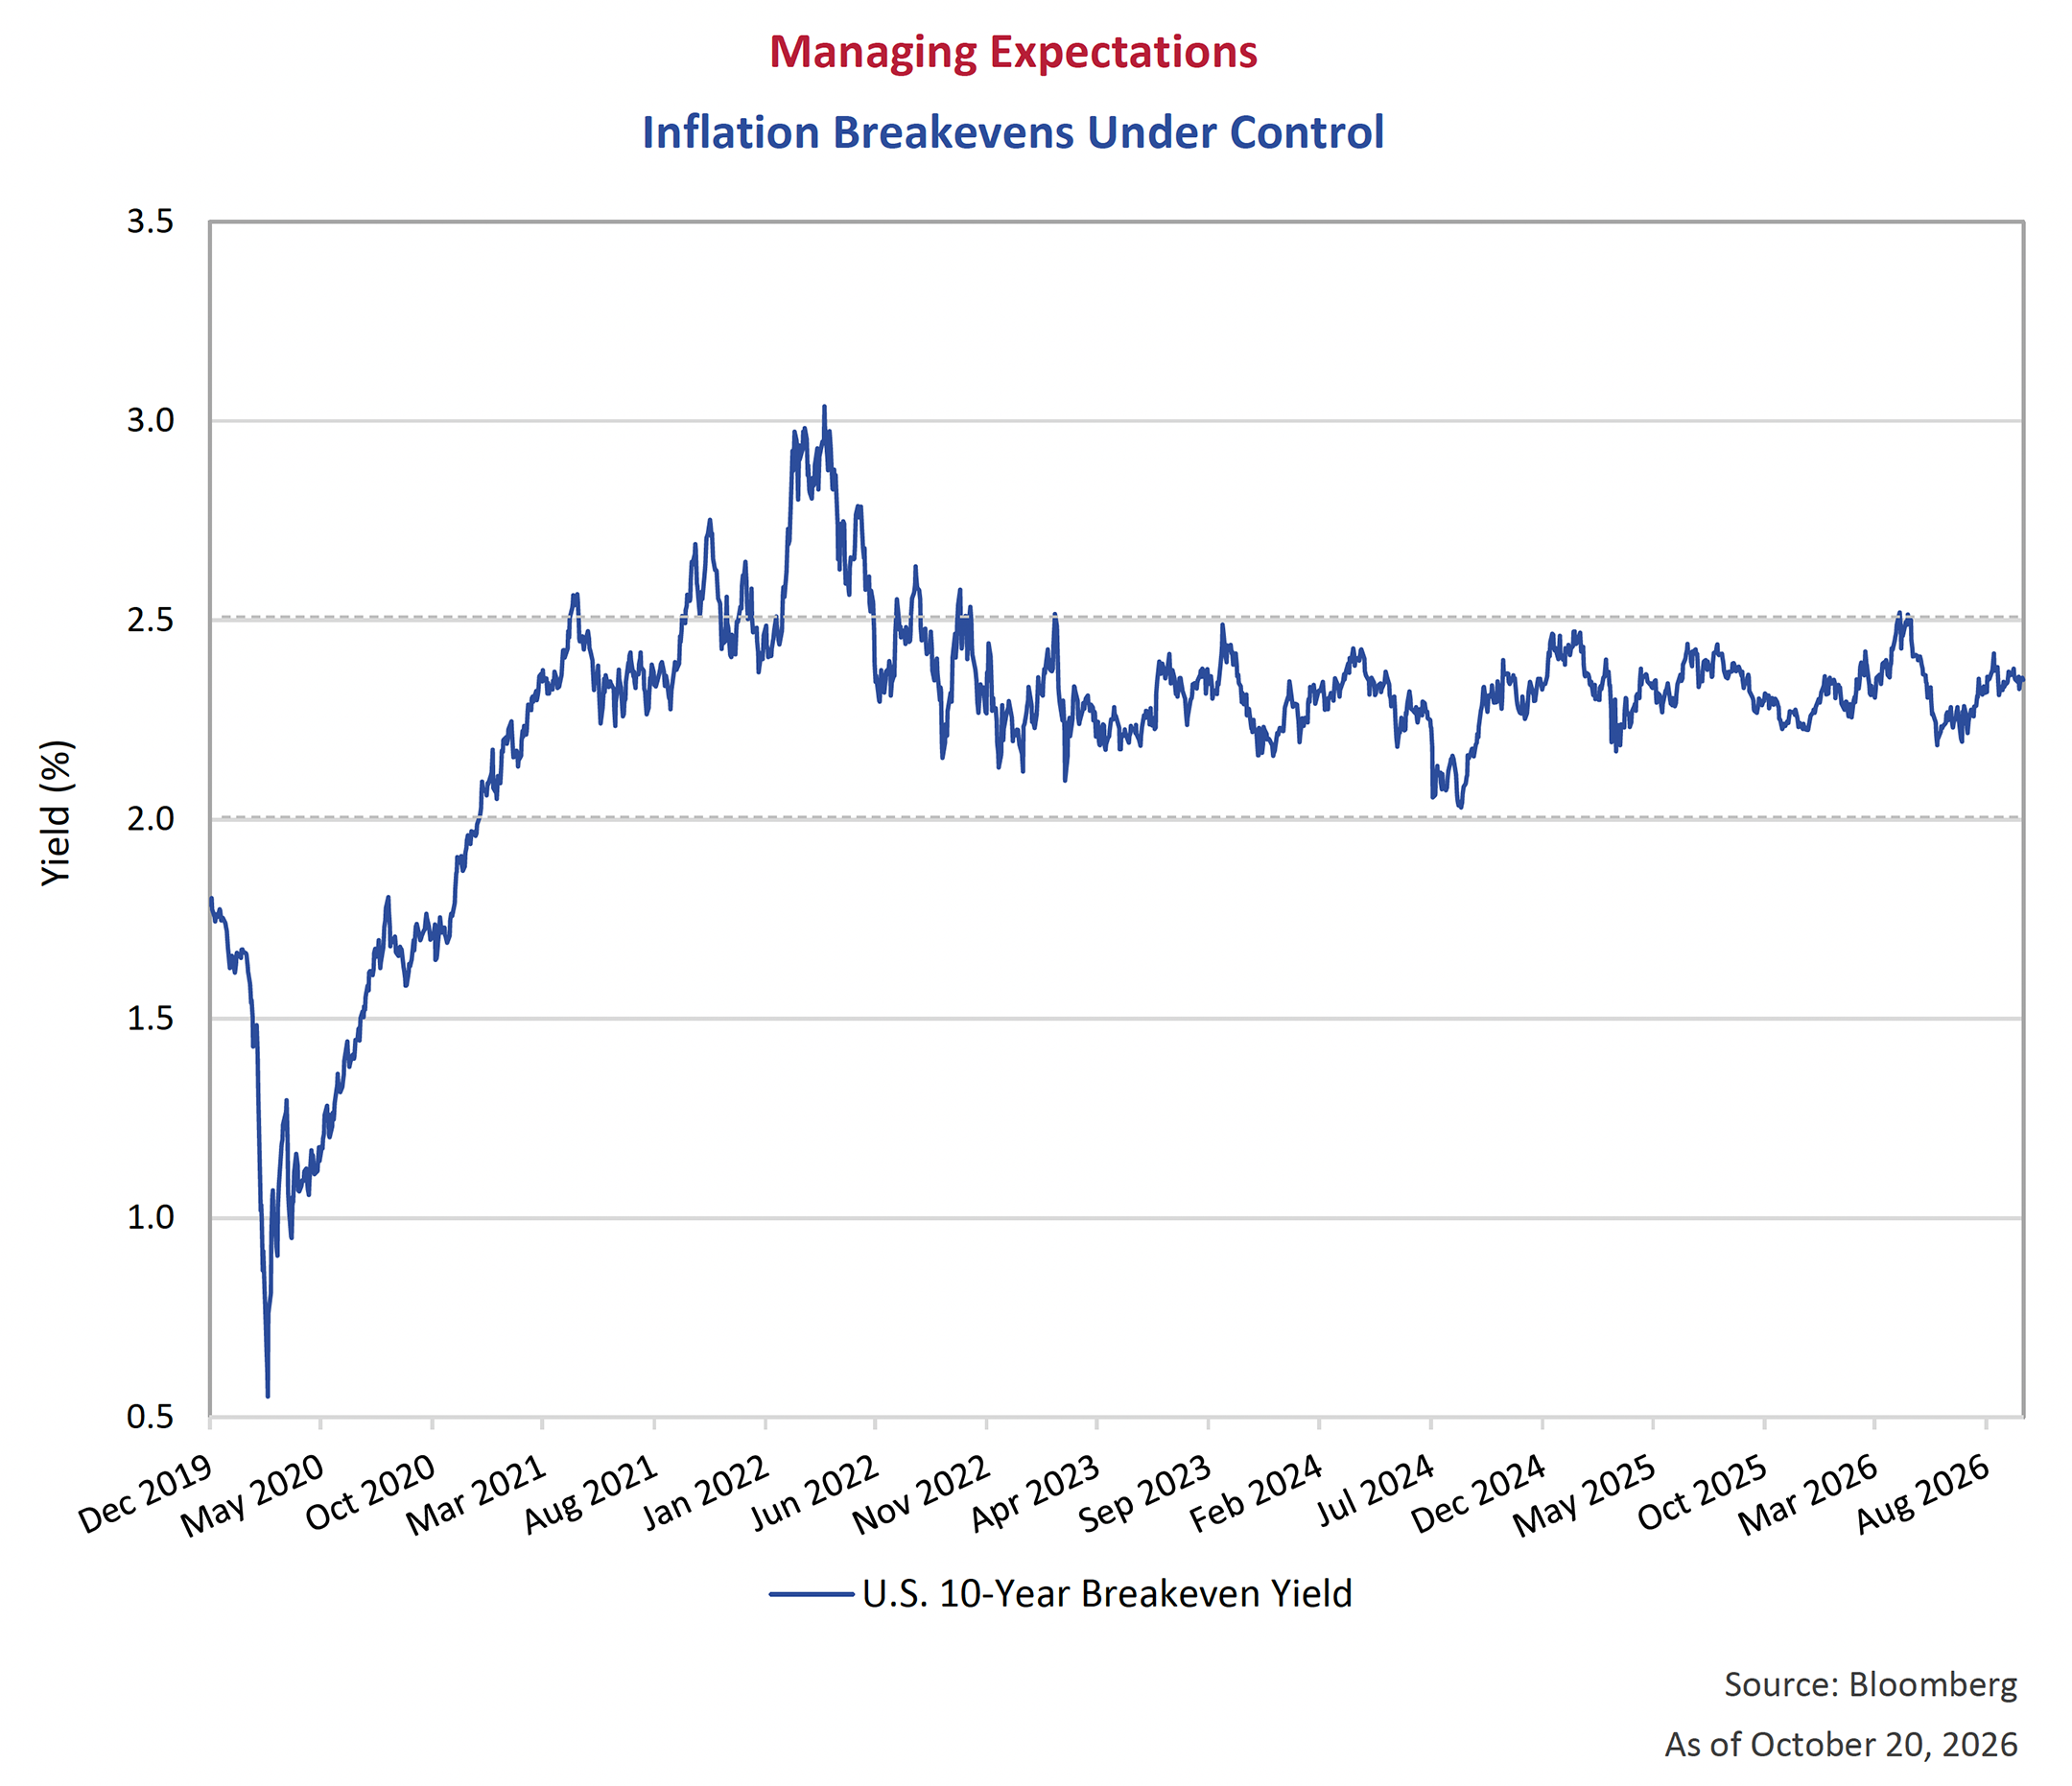
Long-term inflation expectations, represented by the 10-year breakeven yield above, have bounced between 2.0% and 2.5%. With inflation expectations largely unchanged, this means that real yields have been marching higher alongside nominal yields. After a decade of rock bottom rates, bond investors are rightfully demanding compensation for parting with their scarce capital.
Crowding Out??
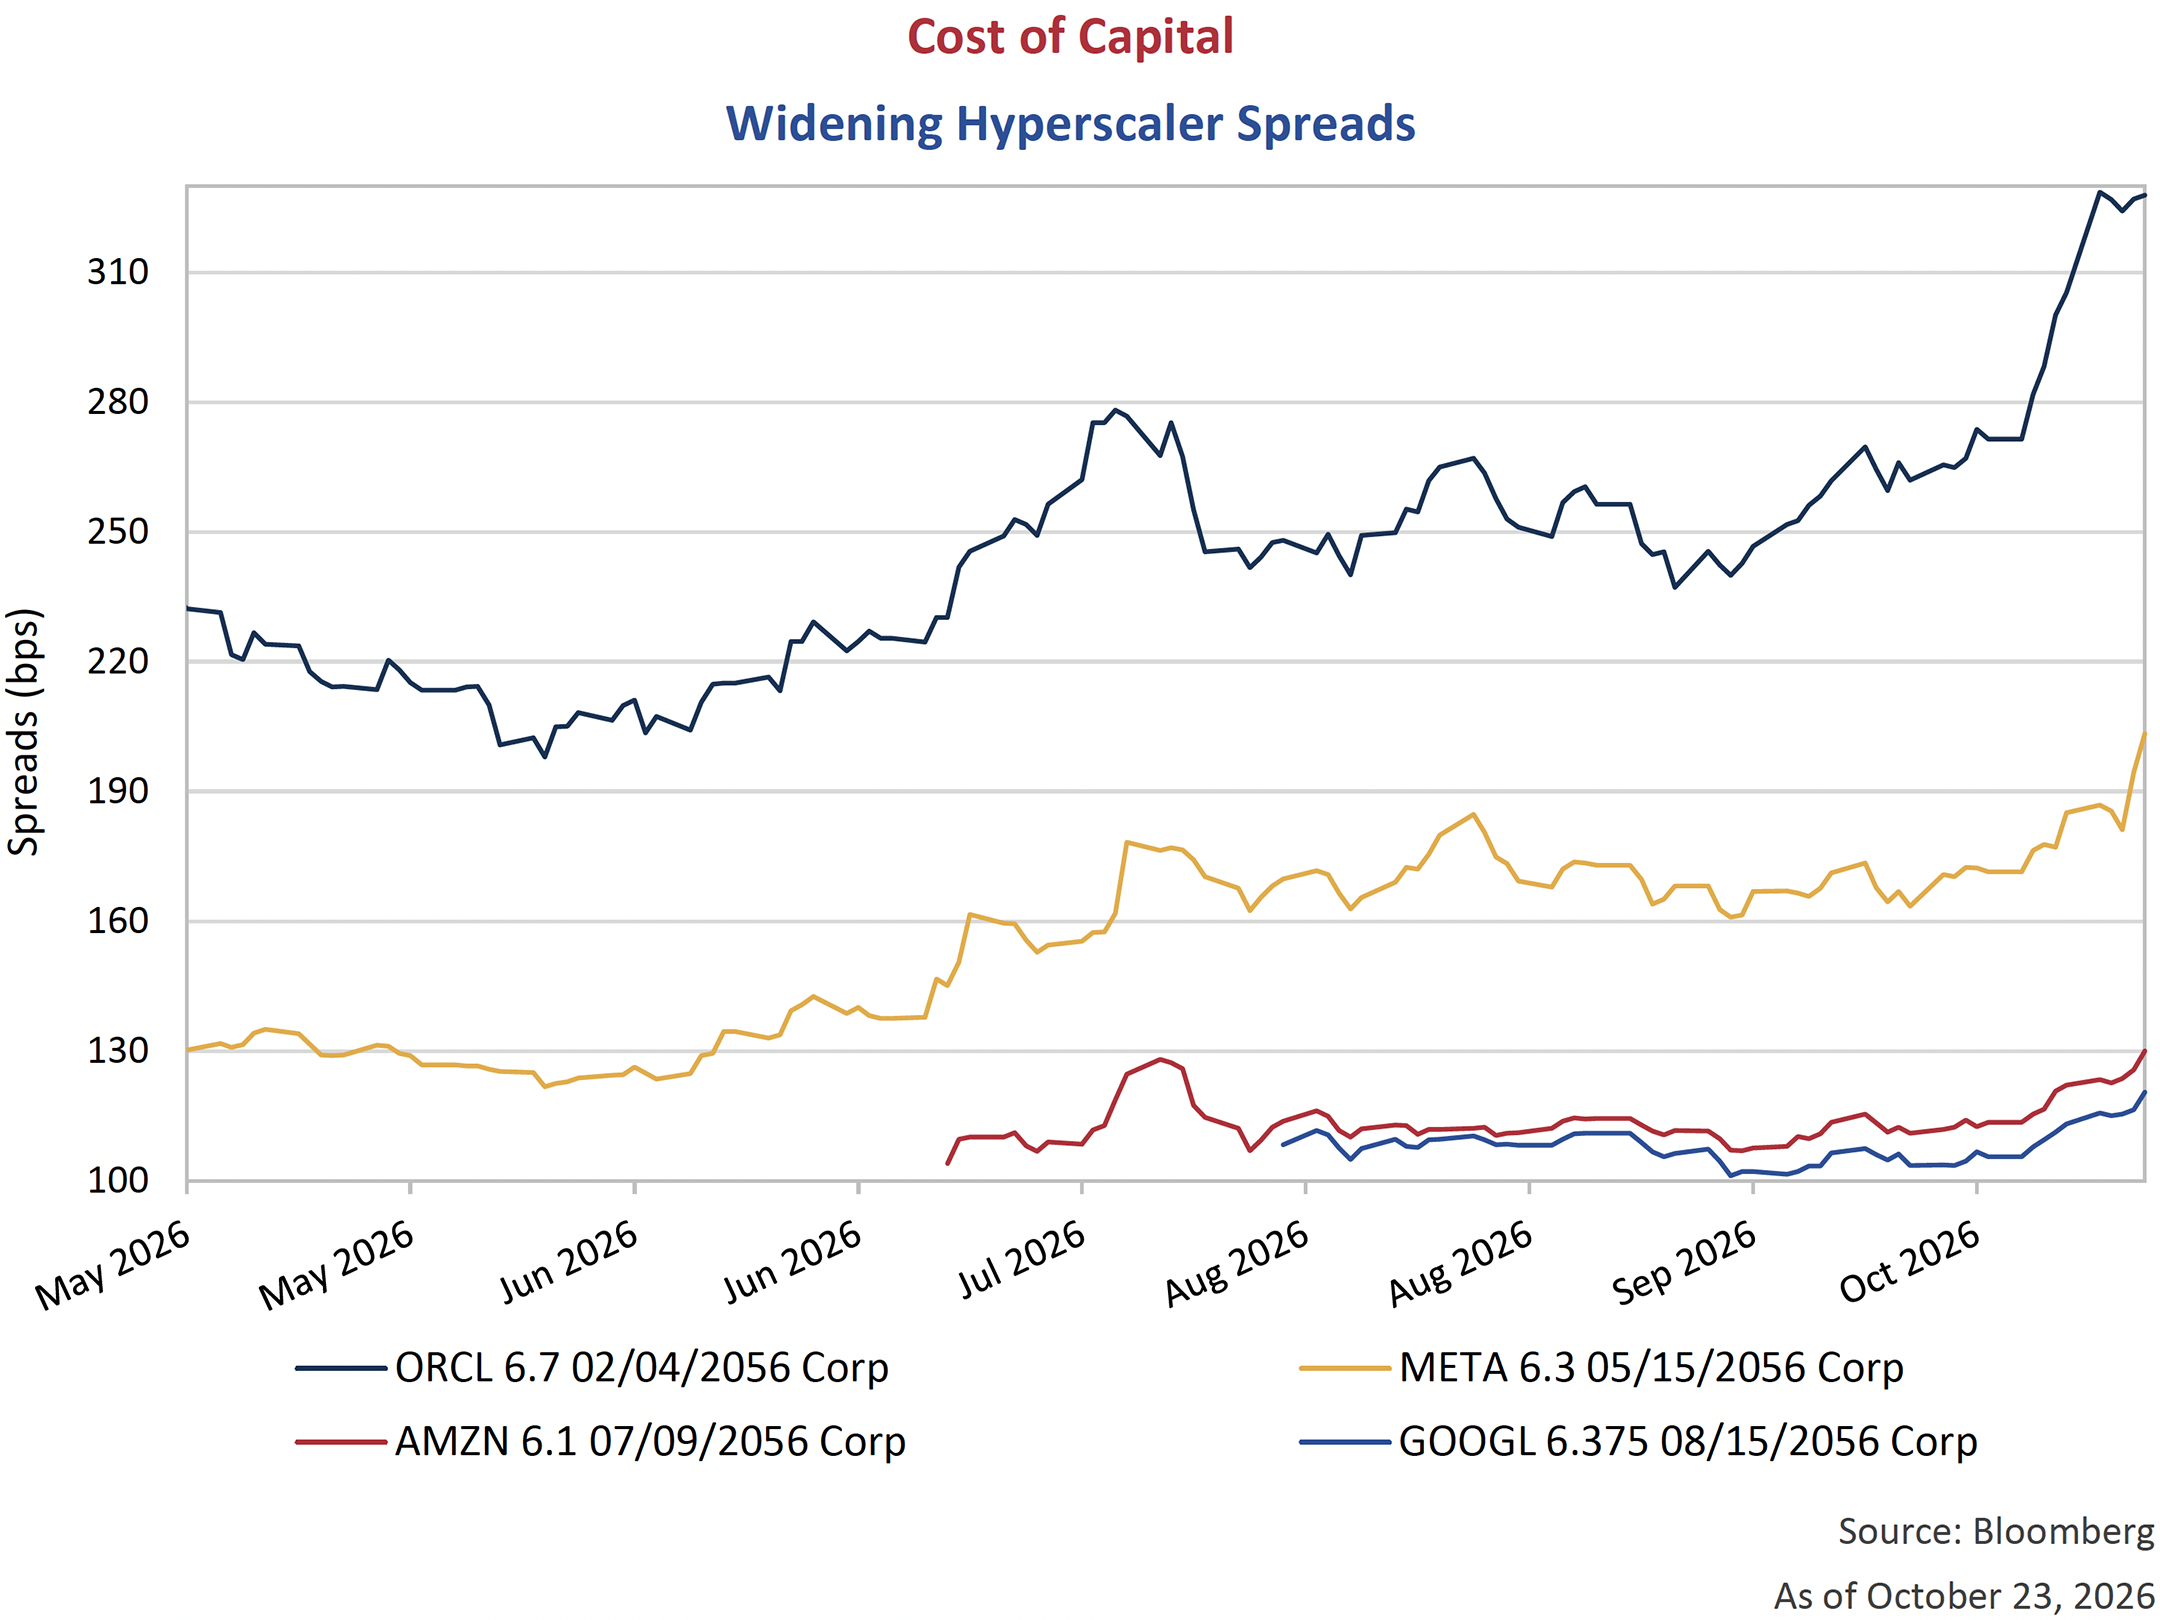
The claim that hyperscalers are crowding out other fixed income issuers has become increasingly difficult to argue with. Four companies; Alphabet, Amazon.com, Meta Platforms, and Oracle, have issued over US$300 billion of corporate bonds over the past 18 months, doubling their weight within the Investment Grade Index. Alphabet and Amazon.com have diversified their funding beyond USD, placing large deals in CAD, JPY, GBP, EUR, CHF and AUD. When you add in the likes of Nvidia, SpaceX and direct data center project level financings, the issuance number grows further. The capex boom requires increasing amounts of credit to support its ambitions and there is undoubtedly more issuance in the years ahead. Moving forward, borrowers will be challenged with higher costs as both base rates and hyperscaler credit spreads are increasing.
Not to be forgotten, there is another issuer in the market testing the limits of bondholder capacity. In August, the total U.S. debt outstanding surpassed US$40 trillion. Of this amount, US$32 trillion is held by external investors. This “Debt Held by the Public” has grown approximately US$2 trillion per year over the past five years and the Congressional Budget Office forecasts this pace to continue over the next five.2 Proposals such as the so-called “Trump Dividend” – a US$5,000 payment to American households – may be politically popular but will do little to reassure bondholders already financing record deficits.3
The Bottom Line
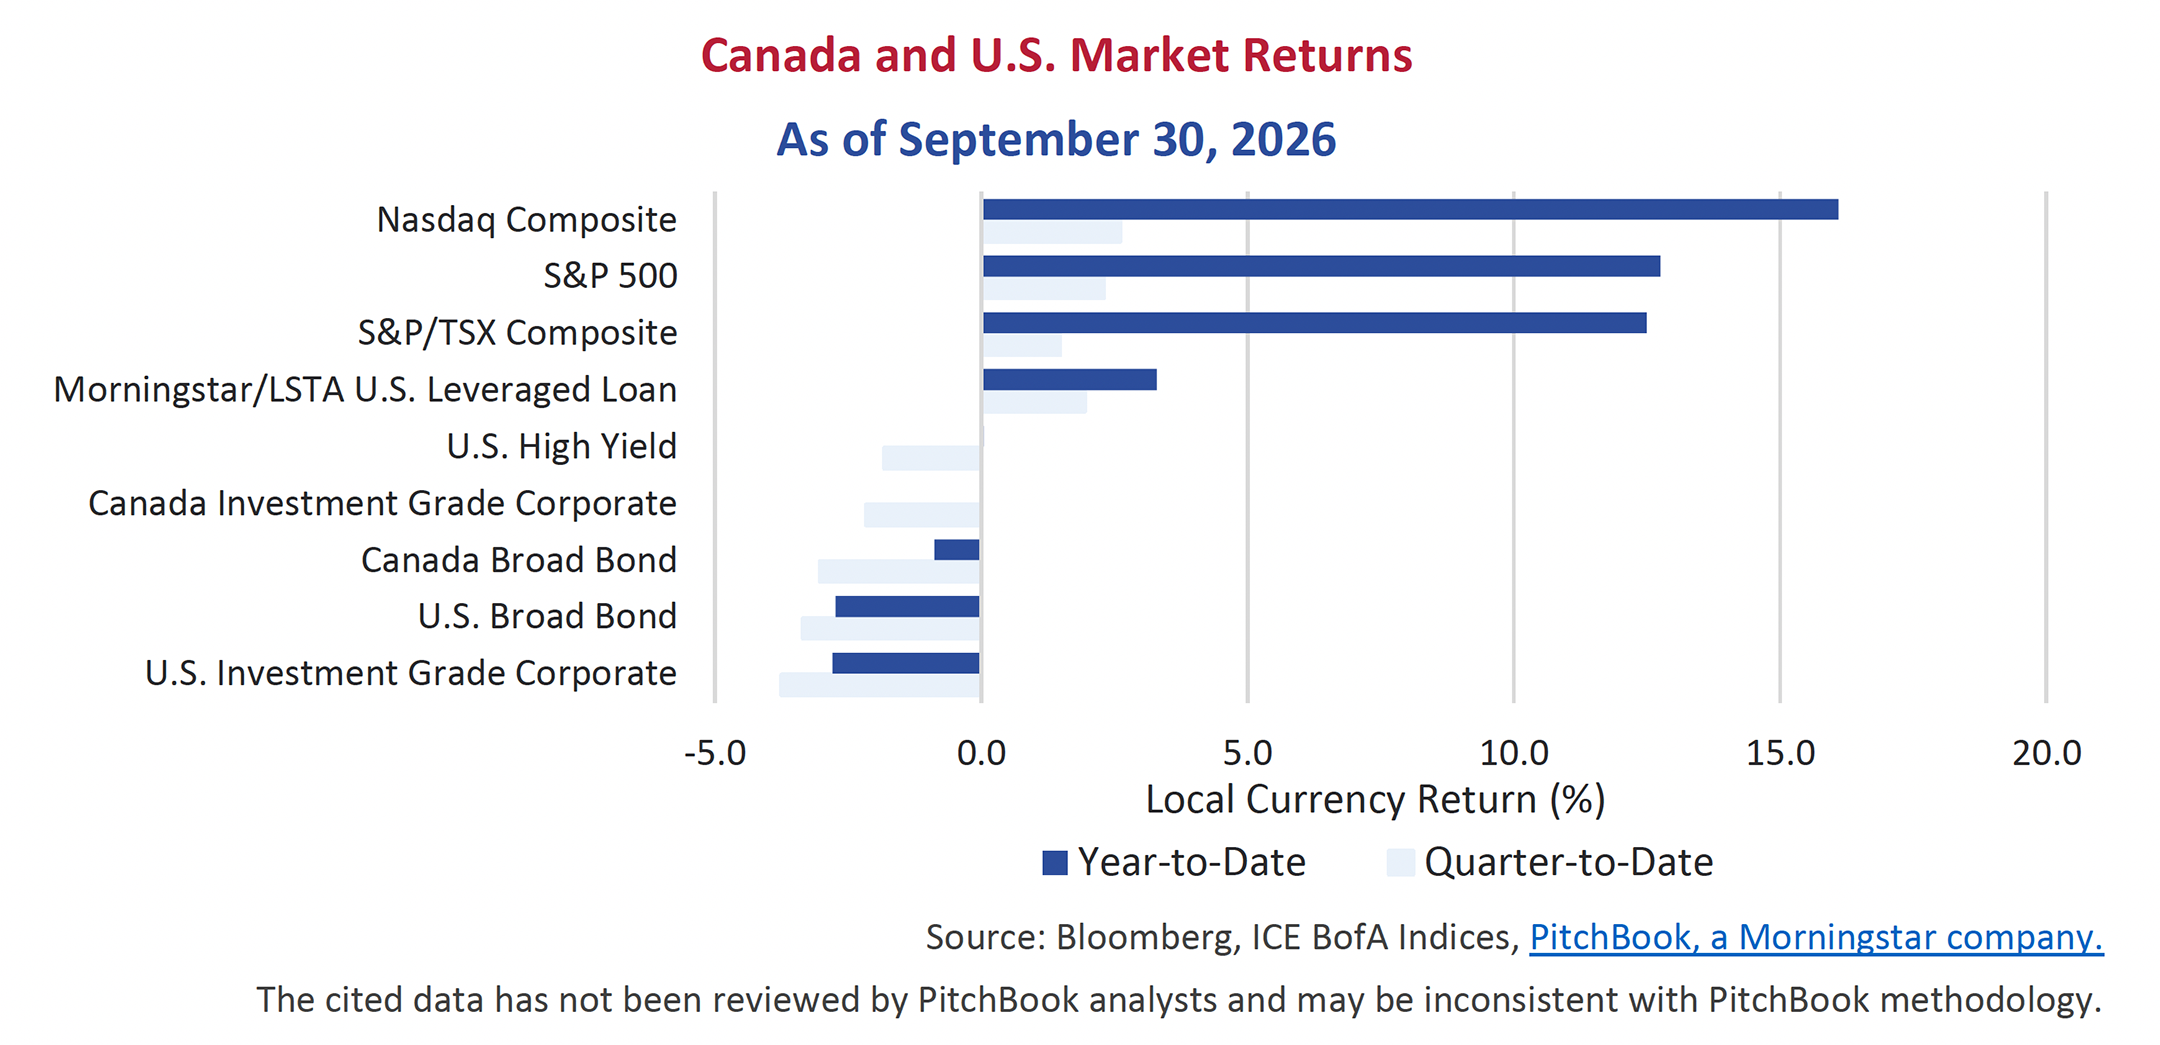
Fixed income markets faced a challenging third quarter as rising yields weighed on government and corporate bond prices in both Canada and the United States. Canadian broad market and investment grade indices outperformed their U.S. counterparts, supported by a smaller upward shift in the yield curve and modest credit spread tightening, while U.S. spreads widened. U.S. high yield bonds outperformed other major fixed income indices despite a 33 bps widening in spreads, as their shorter duration helped cushion the impact of rising yields. Leveraged loans were the only major fixed-income asset class to deliver a positive return, reflecting their floating-rate structure. Equity markets, by contrast, continued to advance in the third quarter, led by the Nasdaq Composite, which gained 2.6%. The S&P 500 and S&P/TSX Composite also posted positive returns of 2.3% and 1.5%, respectively.
Corporate Action
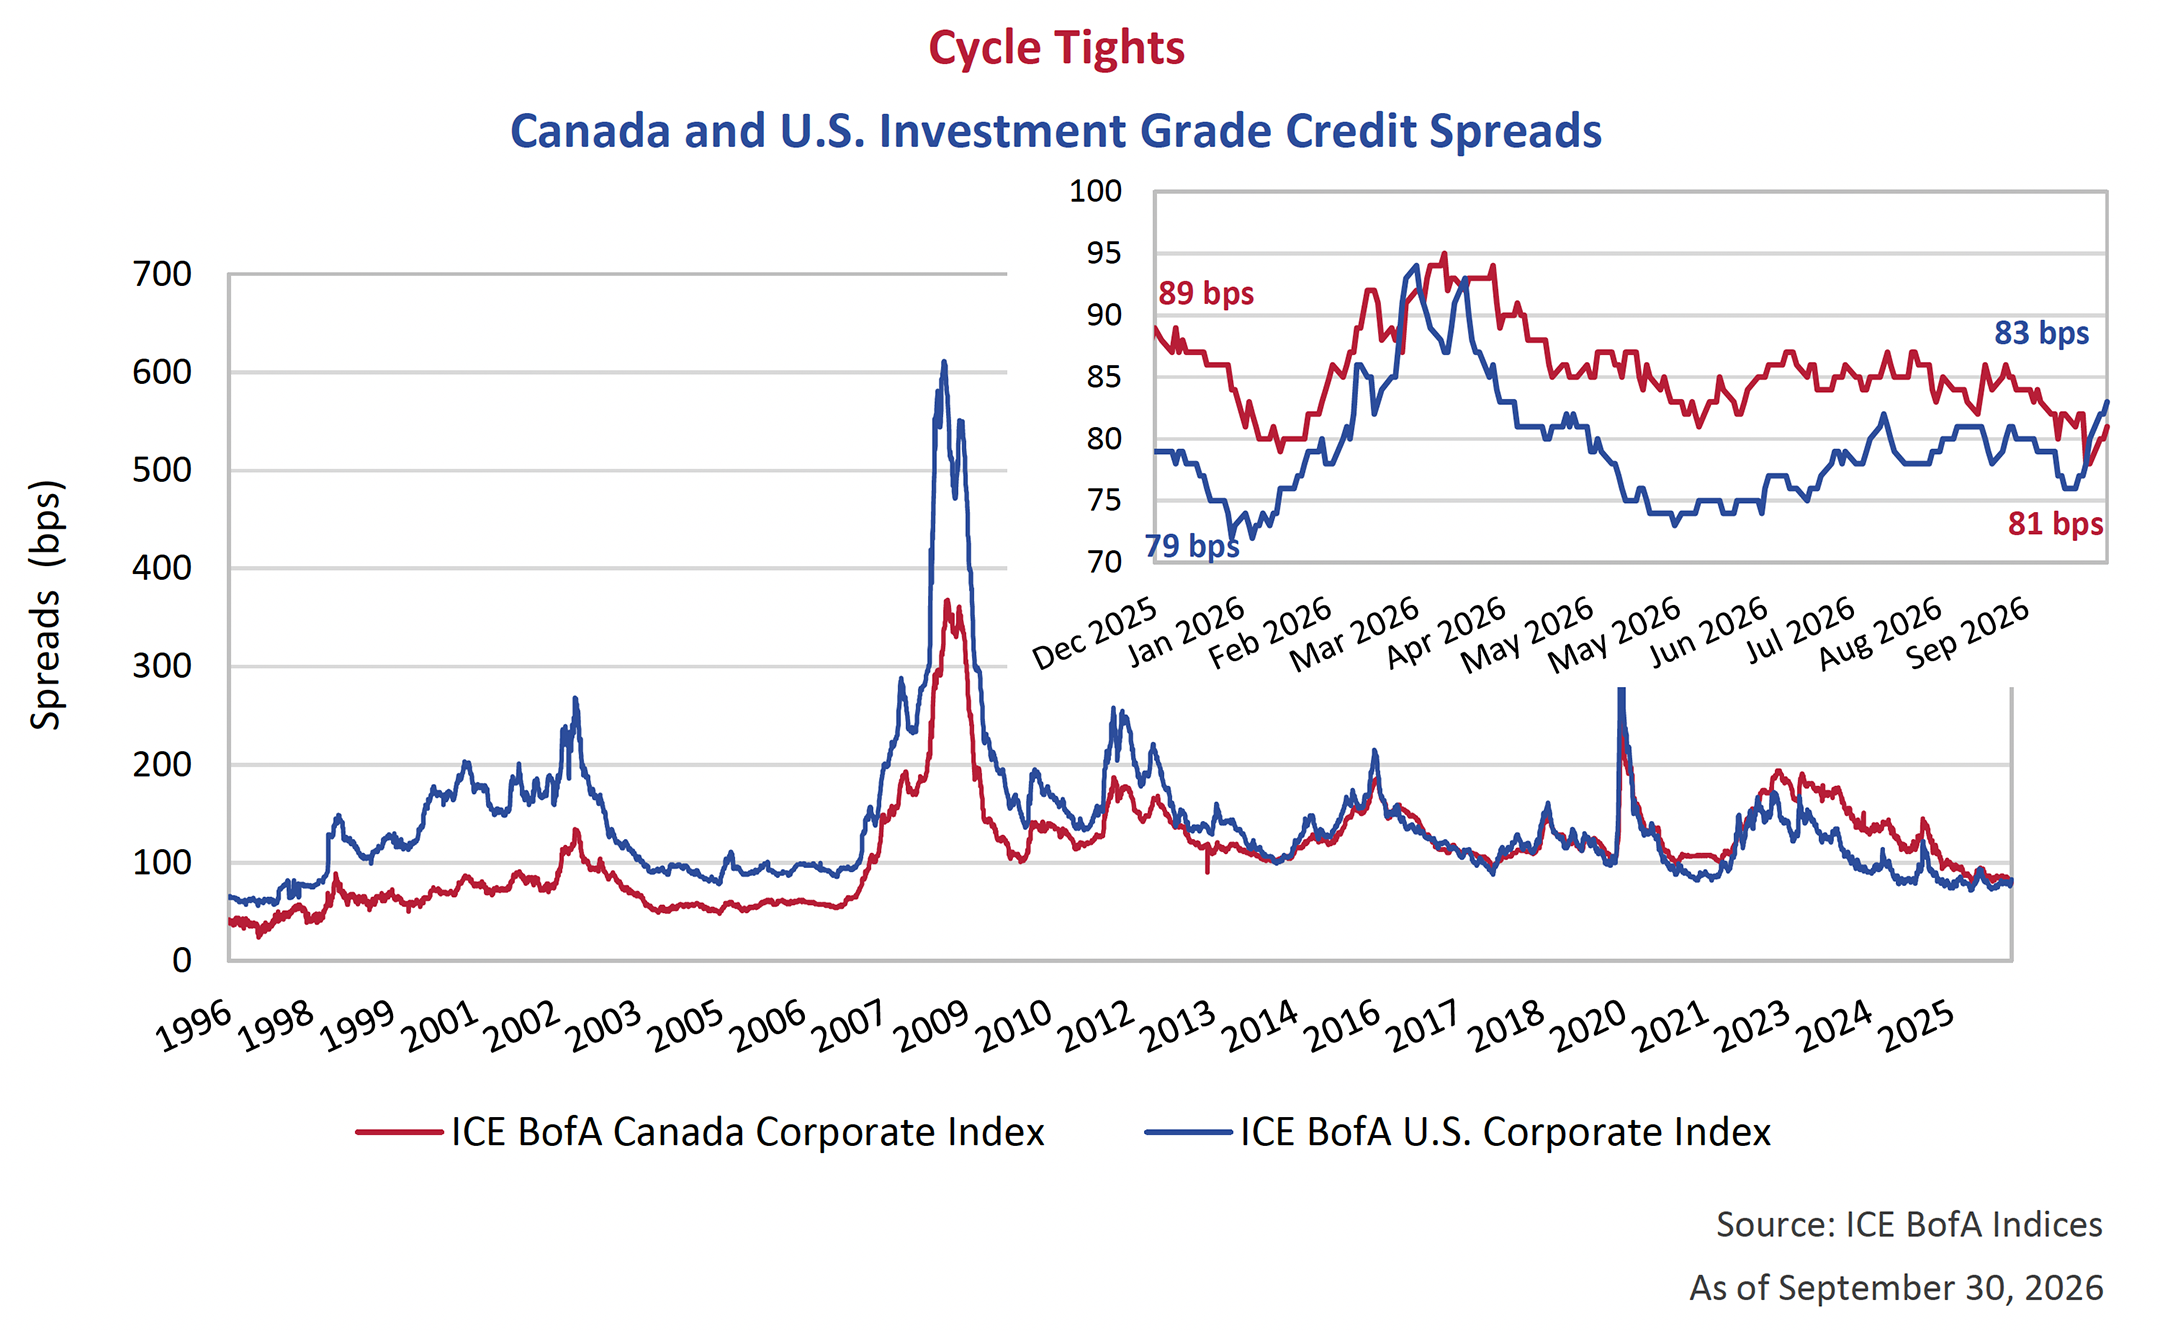
Investment grade credit remained resilient in the third quarter, although performance diverged between the U.S. and Canada. While Canadian spreads tightened from 87 bps to 81 bps, the much larger U.S. market saw modest pressure with spreads widening from 77 bps to 83 bps. Despite these contrasting moves, valuations remain rich in both markets, leaving investors with limited spread protection in the event of deteriorating fundamentals or a broader repricing of risk. In this environment, strong corporate balance sheets and defensive positioning become increasingly important, as a repricing of credit risk can meaningfully erode returns.
How Far We’ve Come
We have been talking for some time about how expensive we view the current credit spread environment. We look back a decade to illustrate our musings. Below we plot every bond in the FTSE Canada All Corporate Bond Index with tenor across the x-axis and credit spread across the y-axis. The red dots represent the 924 bonds within the Index as of quarter-end, September 30, 2016, and the blue dots represent the 1,401 bonds within the Index as of September 30, 2026.
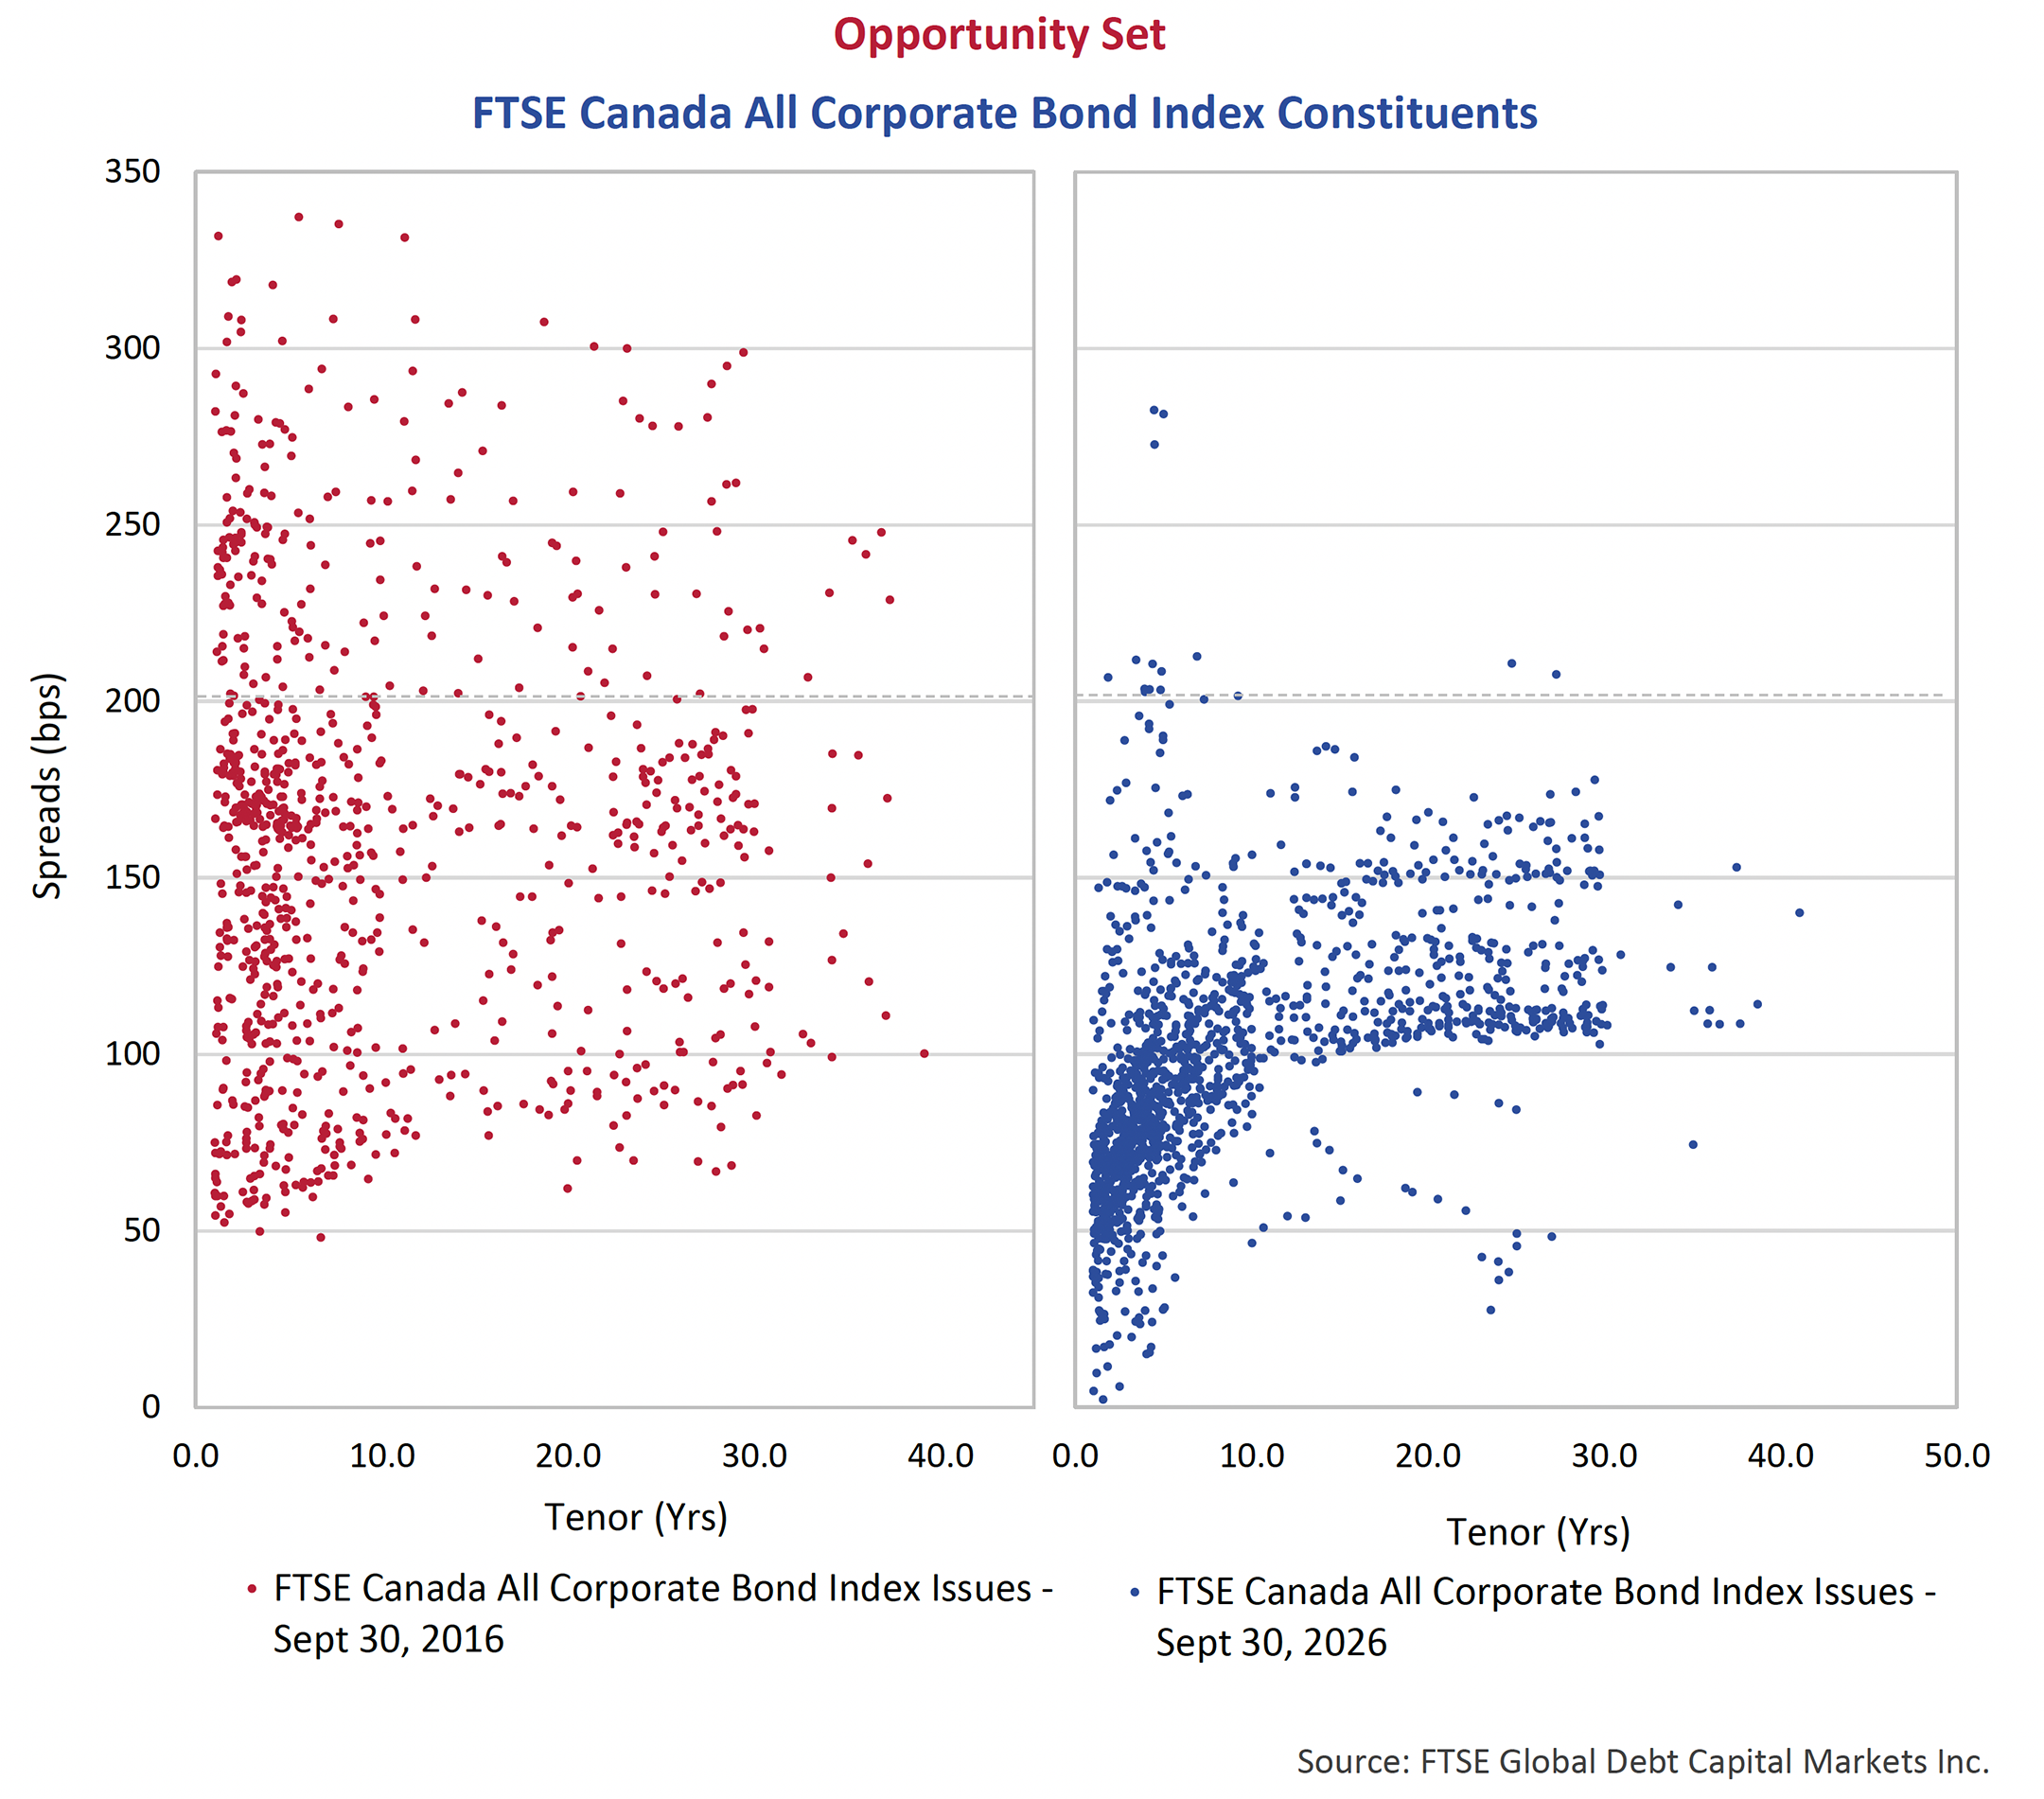
We can see quite clearly that the blue dots of today’s market cluster down and to the left. This indicates that buyers are offered less credit spread, or additional yield premium, for investing in corporate bonds. Shifting to the 2016 chart represented with red dots, we also find significantly more dispersion. If we focus in on corporate bonds marked at a credit spread above 200 bps (representing a yield premium of 2%+ above government bonds) we see a wide selection of red dots in 2016, 222 different bonds to be precise, versus only 17 blue dots in today’s market. Many of the bonds in today’s market offering credit spreads north of 200 bps are junior ranking hybrid bonds, meaning investors looking to secure the same yield premiums today as they could ten years ago are being forced increasingly down the credit risk spectrum to achieve it.
The Good, the Bad and the CCC
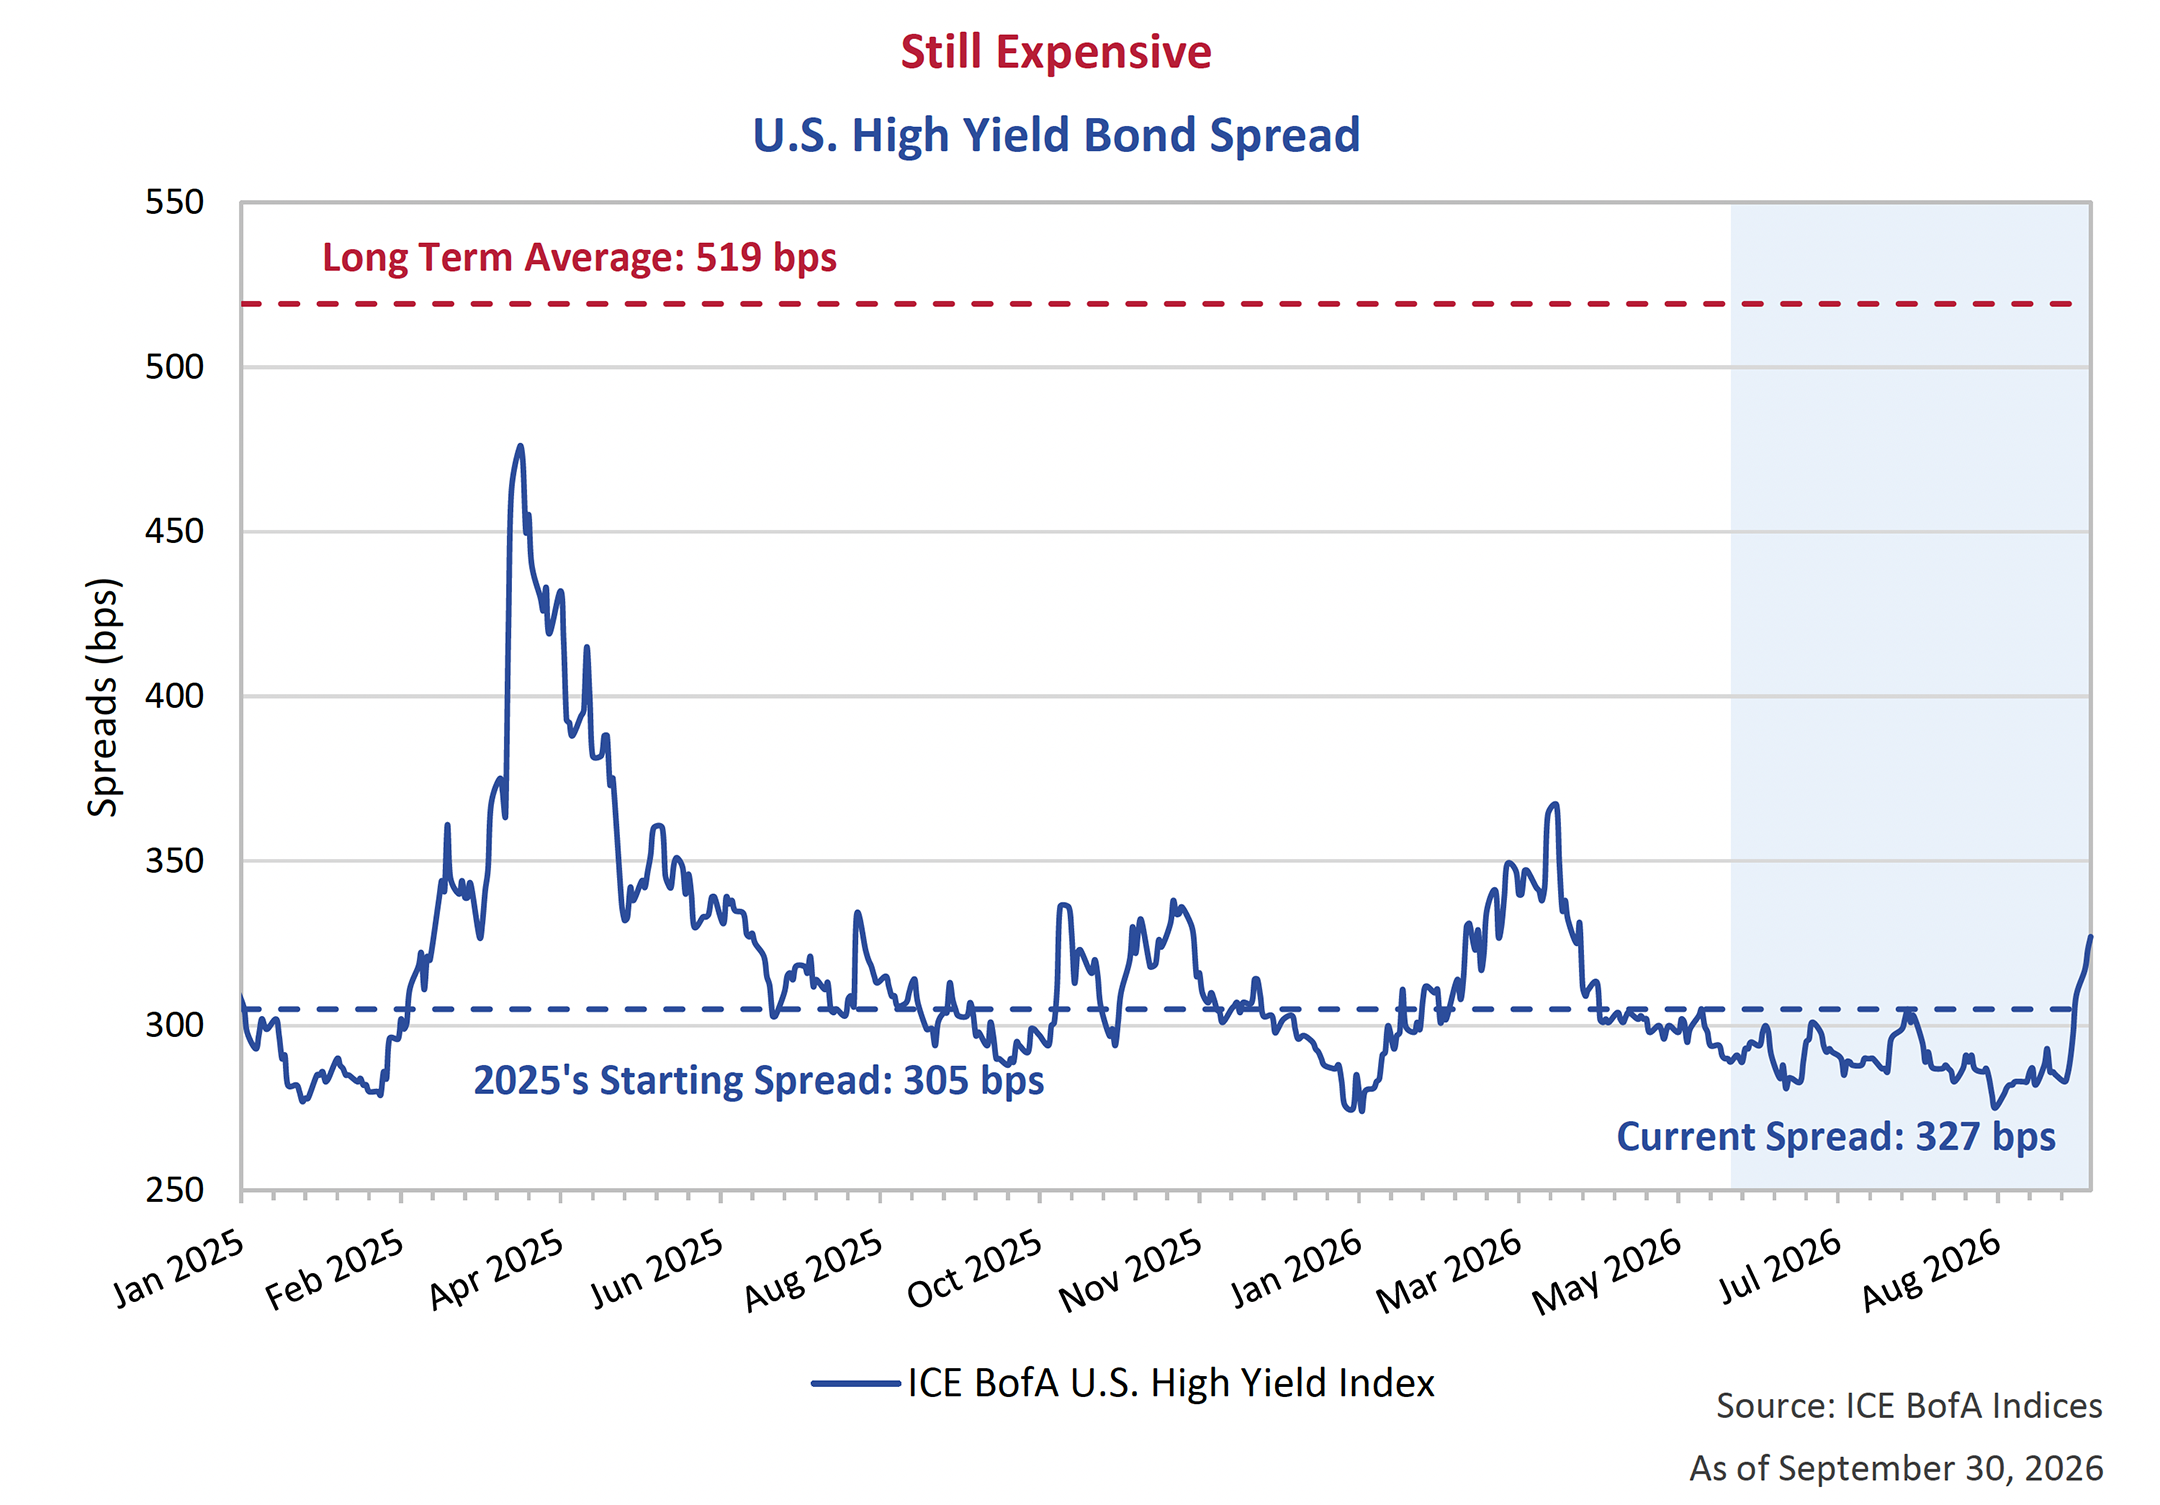
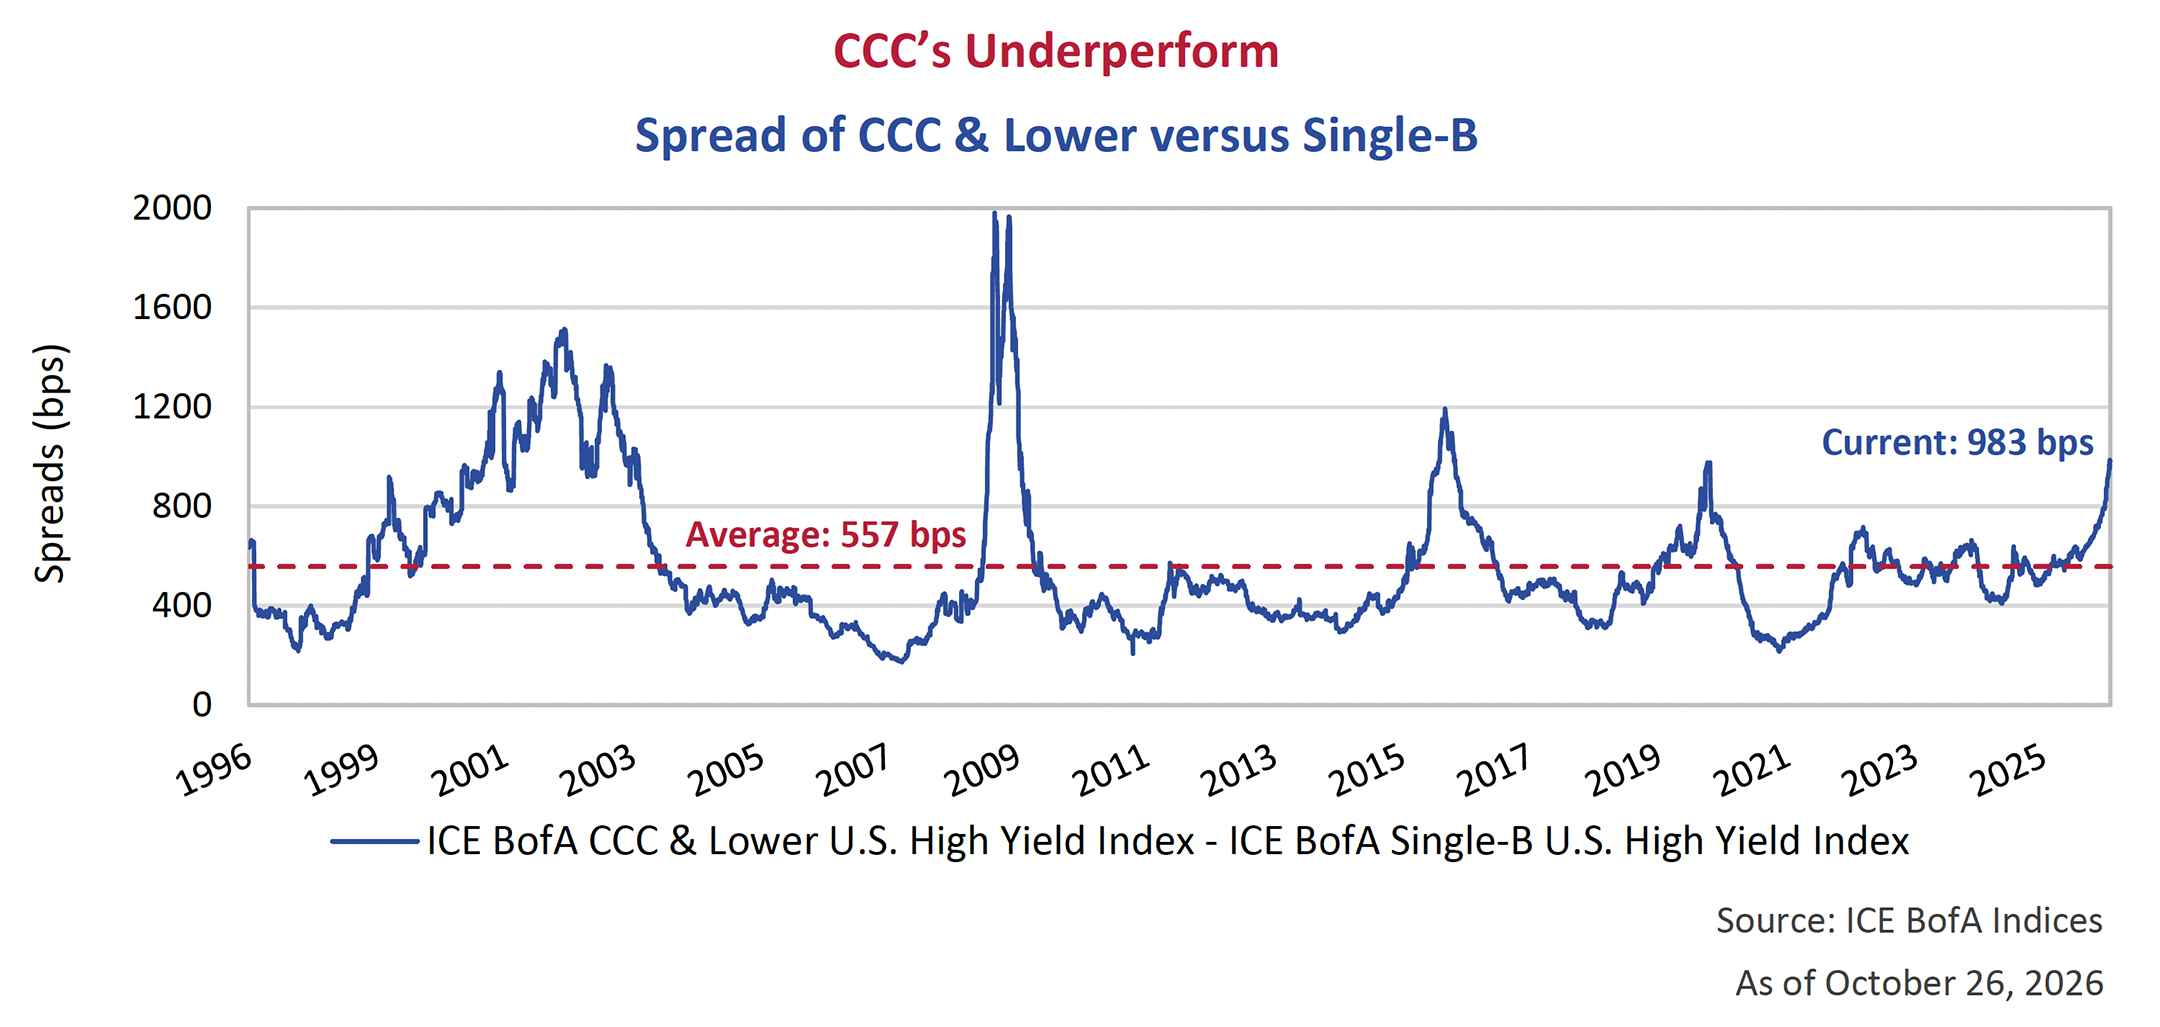
Speaking of down the credit risk spectrum, weakness was more pronounced in high yield credit, where U.S. spreads widened from 294 bps to 327 bps over the three months ending September 30th. The spread widening was driven disproportionately by lower-quality issuers. CCC-rated and lower spreads widened sharply from 978 bps to 1,180 bps, compared with a more modest increase in BB spreads from 186 bps to 211 bps. This divergence points to growing differentiation within the high yield market, with investors demanding greater compensation for weaker credit quality even as broader market spreads remained relatively contained. With valuations leaving little room for adverse surprises, disciplined security selection and a focus on downside protection remain critical to navigating an increasingly uneven credit environment.
Within the CCC segment, much of the widening during the quarter was attributable to a small number of issuers, most notably CSC Holdings and Altice Financing, both affiliated with Patrick Drahi’s telecom empire. While the CCC & Lower Index can be disproportionately influenced by price moves in a handful of distressed issuers, it is still notable that the growing disparity between Single-B and CCC & Lower rated issuers reached 983 bps as of October 26th, a level the market hasn’t seen since 2020. Unlike the COVID-19 period, the stress hasn’t been felt across the broader market. Instead, investors are deepening the distinction between the lowest rungs of the credit spectrum and their Single-B and BB rated high yield peers.
Blockbuster
The all-time largest single-day debt sale by a public company arrived in September 2026 as Paramount Skydance tapped debt markets to fund its acquisition of Warner Bros. Discovery. The US$52 billion debt deal included US$30 billion investment grade rated 1st lien bonds, US$12.4 billion high yield 2nd lien bonds, and US$9.5 billion loans. Initial demand appeared strong, with the investment grade tranche reportedly attracting more than US$109 billion of orders (3.6x covered), while the 2nd lien tranche set a record as the largest high yield bond offering by size. However, the enthusiasm faded quickly, with secondary trading weakening days later and Credit Default Swap (CDS) levels widening above Global Financial Crisis (GFC) highs. While the transaction ultimately cleared the market, its reception contrasted with the near-effortless spread compression that characterized many of the year’s earlier financings.
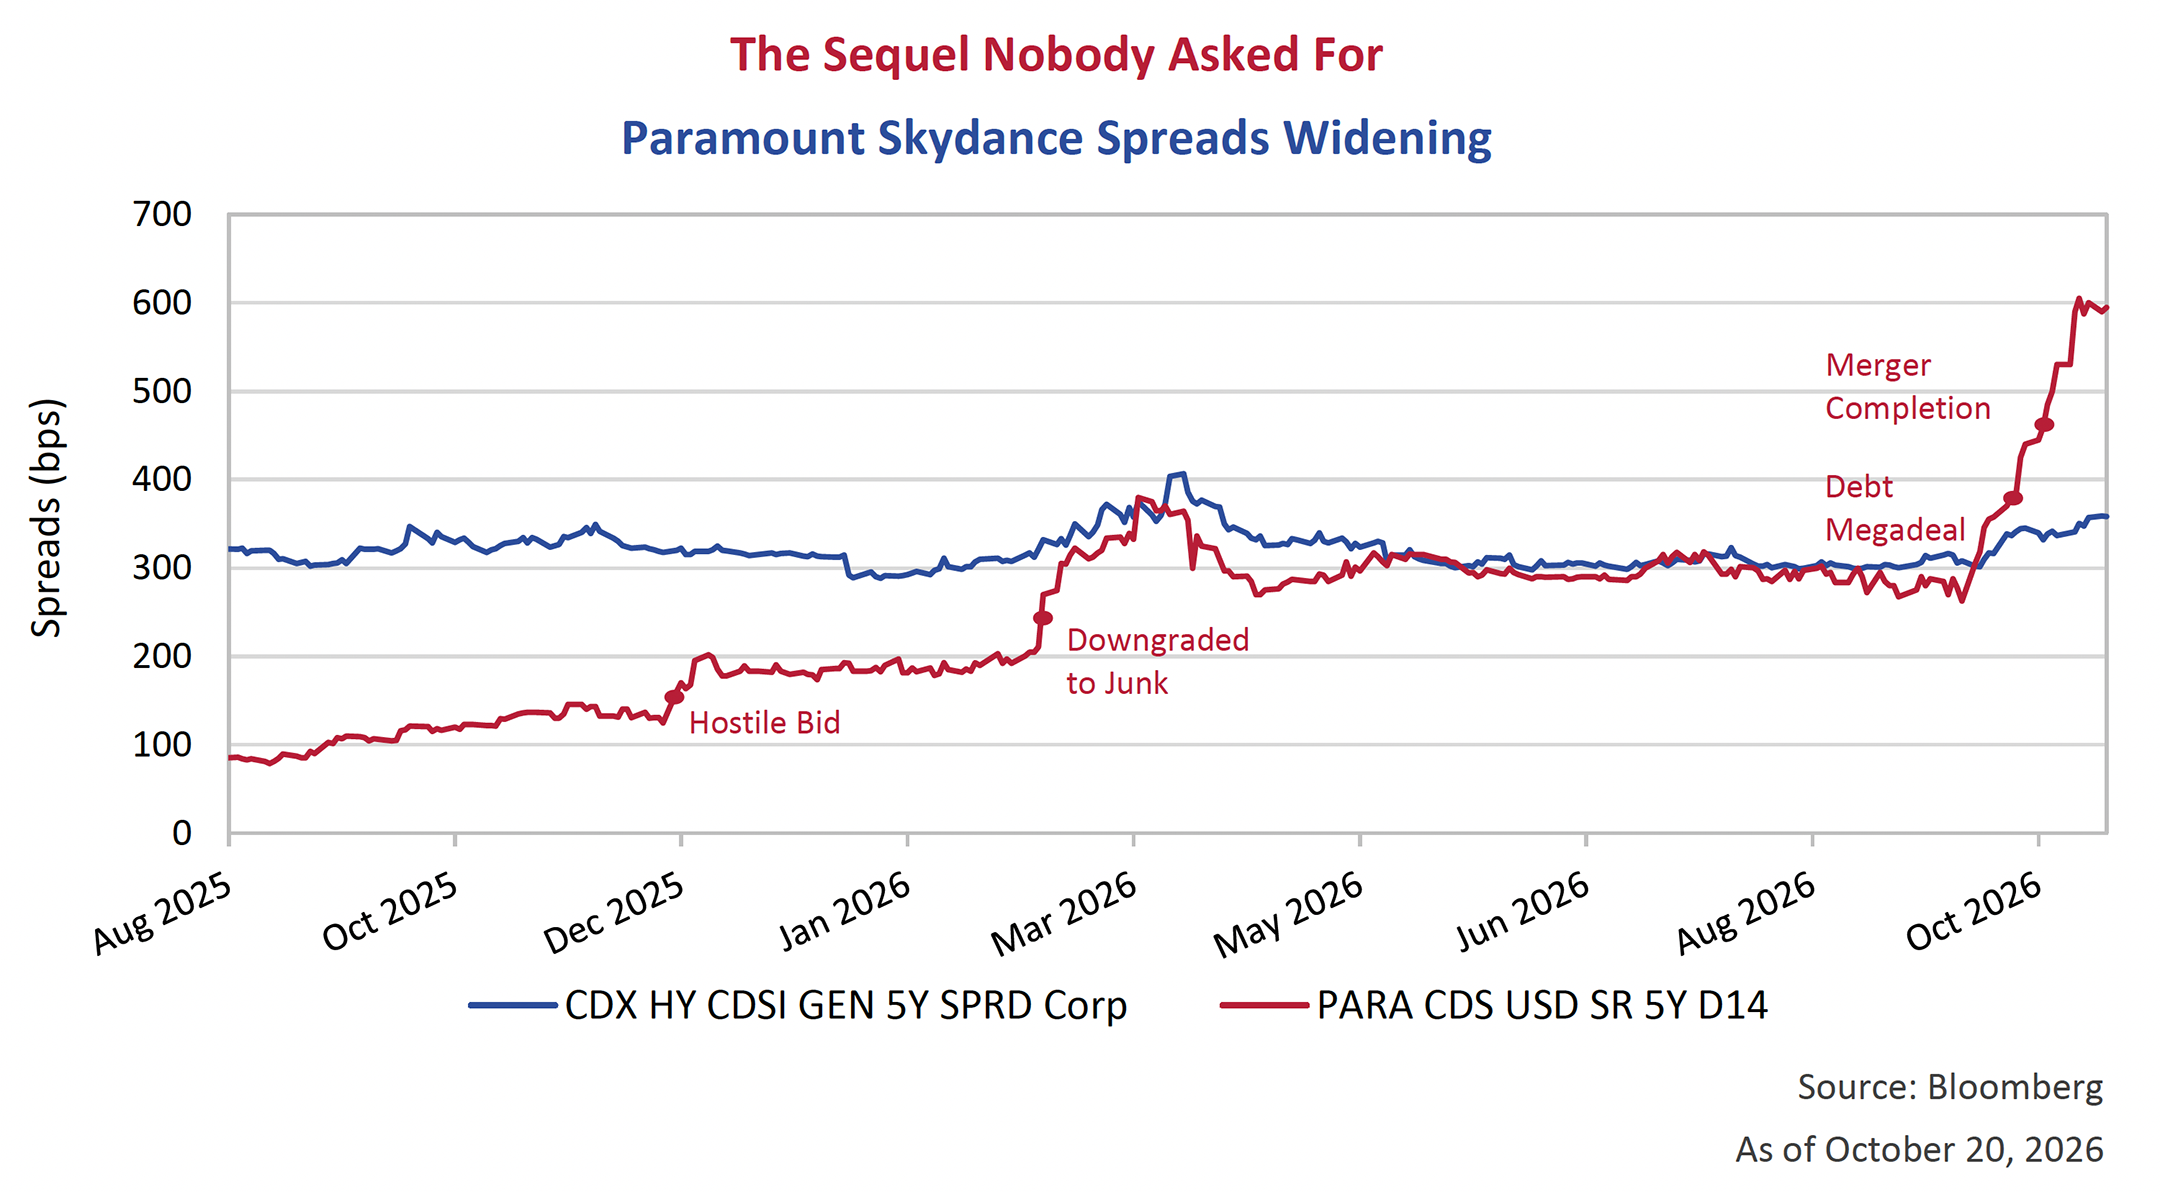
The acquisition mashes together two heavily leveraged entities generating the majority of their cash flows from declining linear TV networks while attempting to build scale in competitive Direct-to-Consumer (DTC) streaming. The acquisition logic relies entirely on aggressive cost synergy forecasts, leaving the newly formed entity drowning in operational friction under an US$87 billion debt stack that leaves pro forma interest expense consuming all cash flow.
The market has spent the better part of the last two years rewarding scale, leverage, and ambitious capital spending plans with little discrimination. The legacy of this record-breaking deal may be less about its massive size, and more that it served as an early warning that investors are no longer willing to absorb aggressive corporate balance sheets without demanding a much higher risk premium.
God’s Power
Might this warning serve as a valuable lesson for the Artificial Intelligence (AI) crowd? Paramount Skydance’s record-breaking high yield bond offering surpassed the previous benchmark that was set … 7 days prior. On September 23rd, SoftBank Group Corp came to the high yield bond market with a US$11.1 billion multi-tranche, multi-currency offering. The Japanese technology investor was seeking capital to fund its own AI investments, including data center ventures and equity commitments to companies such as ChatGPT maker OpenAI. The unrelenting demand for AI compute is being met with extraordinary demands on capital to fund it.
It appears the buildout is beginning to confront economic reality. In late September, it was reported that Oracle provided a notice of “Force Majeure” to counterparty Blue Owl Capital on a massive data center project under construction known as Project Jupiter. Normally reserved for wars and acts of God, Oracle is looking to use this legal mechanism to defer costs, as they expect construction delays on the project. A 17-mile natural gas pipeline required to power the facility has been repeatedly rejected by state regulators. Blue Owl is in luck though, as Oracle is ultimately responsible for the pipeline and therefore this delay will only partially reduce the payments that Oracle, as lessee of the facility, will pay.
Fundamental Research
While the Oracle move is being done pre-emptively, it is not hard to see how risks surrounding these mega-projects are beginning to worry investors. There is financing risk, construction risk, regulatory risk, power procurement risk, supply chain risk, counterparty risk and refinancing risk, to name just a few. Creative bankers, financial engineers, and private market participants have been generating unique structures for each new deal as they look for innovative ways to bring in the massive amount of capital needed. Most structures are designed to keep the risk from appearing on the hyperscalers balance sheets while many also provide contract outs for construction delays.
As a lender, understanding what you are investing in is as important now as it ever has been. The risks in these markets are not uniform and contractual loopholes can lead to low recoveries. As companies find new ways to obscure their real financial commitments, accounting standards continue to lag new enterprising financial structures, and as issuers intentionally bake in “outs”, the risks to investors increase. The one belief that holds markets together is that today’s investments will lead to tomorrow’s prosperity. We are positioned for whatever that outcome might be.
Footnotes
- Source: Breuninger, Kevin and Reid, Jenni. (2026, September 8) Canada’s retaliatory tariffs worth CA$27.6 billion take effect as trade rift with U.S. deepens.
- Source: FiscalData.Treasury.gov (2026, October 26) Debt of the Penny.
- Source: The White House (2026, September 10) Trump Dividend: America Is Winning — and Americans Should Win With It.