Fifty-Fifty
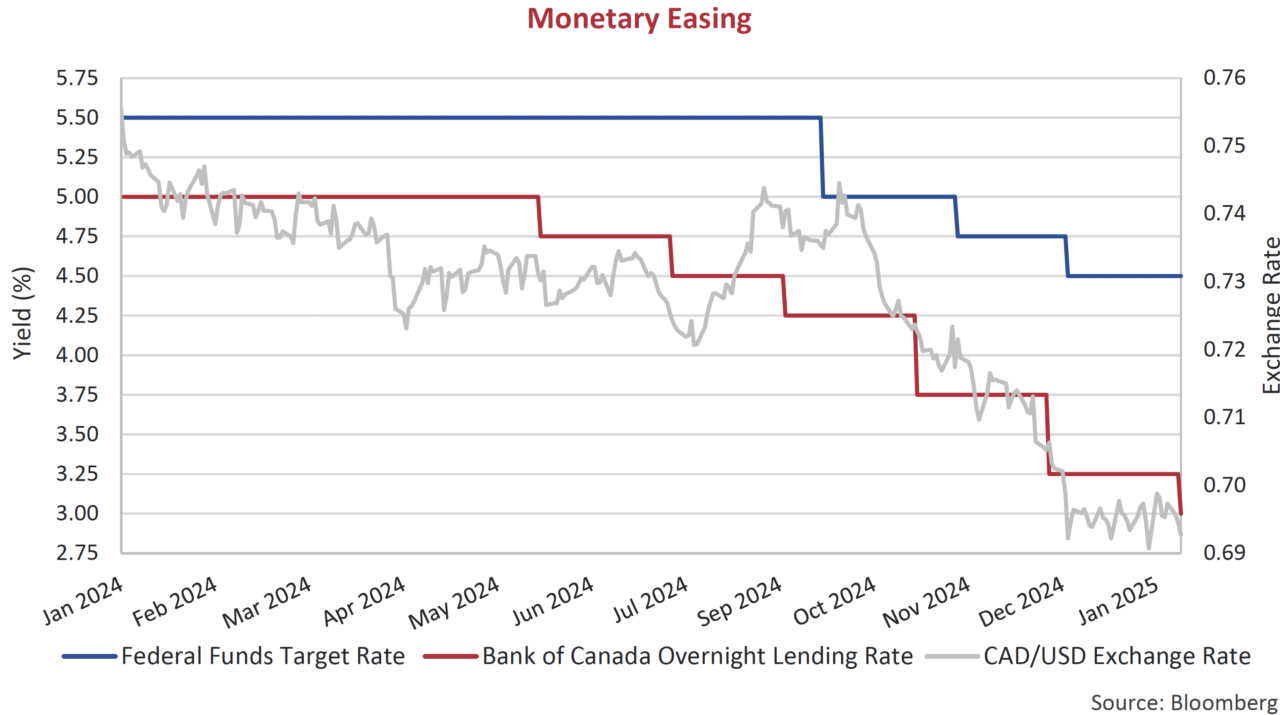
In the fourth quarter, the Bank of Canada (BOC) implemented two consecutive 50 basis points (bps) rate cuts. The overnight rate in Canada, which started 2024 at 5%, now sits at 3% following the BOC’s latest cut on January 29th. The 200 bps cumulative decline over the past 8 months is double the speed of U.S. easing, leaving both our overnight rate and our currency much lower.
About-Face
The drop in administered rates by the central banks did not translate further out the yield curve. Since the Federal Reserve (Fed) implemented their first cut on September 18th, the U.S. long bond yield has actually risen 1%. In price terms, this represents a 15% decline. The offsetting moves erased a yield inversion that existed for more than 2 years.
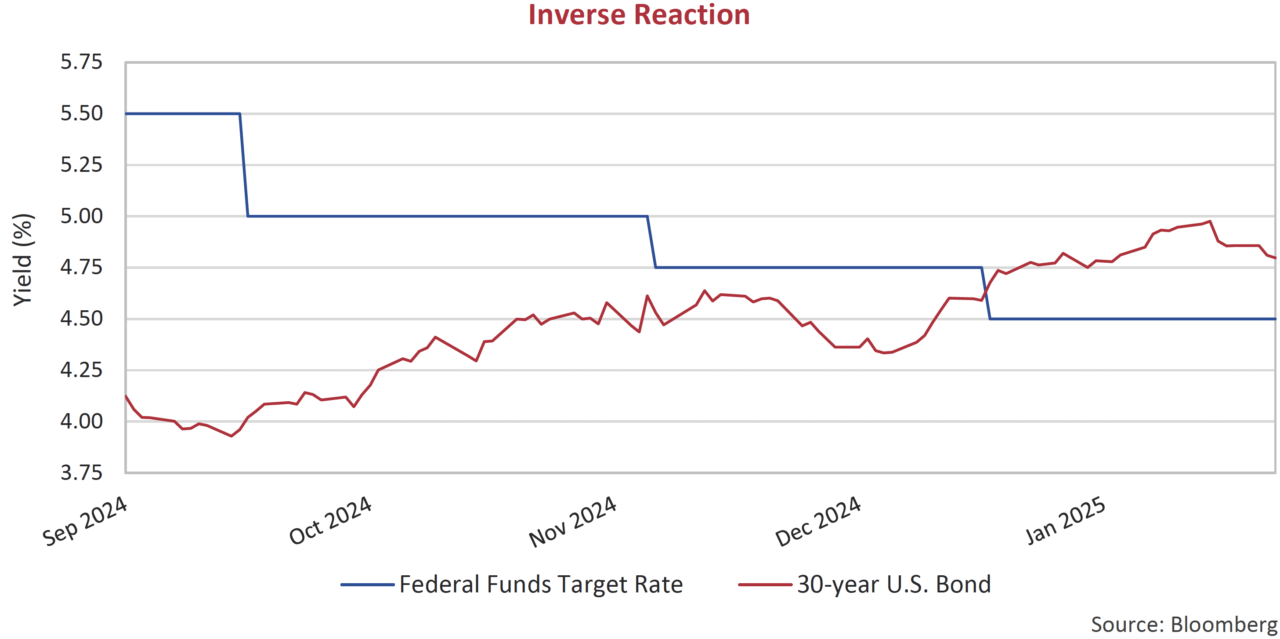
The resilience of the U.S. economy has both the Fed and bond investors re-evaluating the future path of interest rates, sending longer term bonds yields higher. While inflation in the U.S. has come down, it remains above the Fed’s two percent target. The political uncertainty surrounding the newly installed Trump administration and corresponding worries about the size of government deficits has also added to the pressure on government bond yields. The bond markets are rightfully wary about the inflationary impact of tax cuts and tariffs.
Canadian Premium
What’s surprising to us at Canso is the widening spread between U.S. and Canadian government bond yields. Long-term bond yields have also risen in Canada, but they have not kept up with the move stateside. The yield on the 30-year U.S. Treasury bond now sits at 4.8% versus 3.4% for its Canadian counterpart. The 1.4% difference, or 140 bps, is historically wide. We plot this relationship back to the 1940s to note the significance.
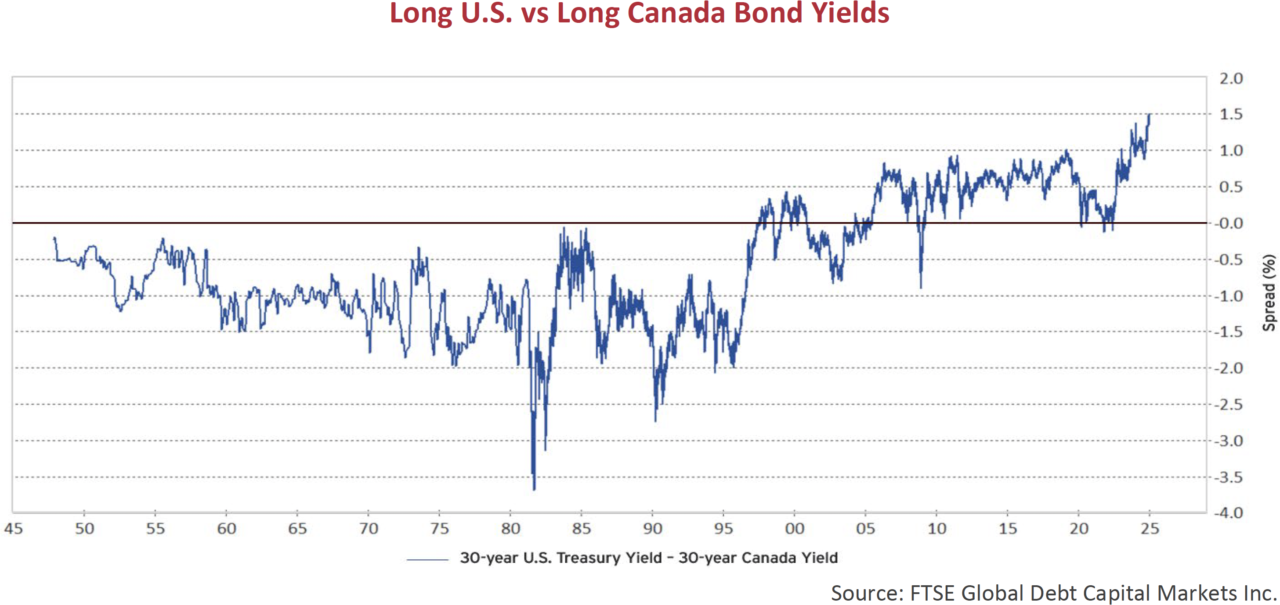
Canso was founded in 1997. Prior to this time, the U.S. long bond yield had always been lower than in Canada. But for the past 28 years, the inverse has largely been true. Might this be due to Canada having a higher credit quality? A more robust economy? A firmer control on inflation? Our response to these points would be, “Unlikely”. In our view, this Canadian premium (or discount depending on how you view it) is not based on fundamentals. If the Canadian economy experiences further weakness, we believe there is underappreciated risk to long Canada yields, especially relative to U.S. levels.
The Bottom Line
Equity markets continued their ascent in the final quarter of 2024. The Nasdaq Composite led the charge, up 6.4%, as investor optimism around artificial intelligence continued. Canadian markets also rose, pushed higher by positive performance in financials and our own technology darling, Shopify. While equity markets met the election of U.S. President Trump with approval, bond markets weren’t so sure. It was a more challenging period for U.S. fixed income markets as government yields repriced higher. Capital appreciation from shrinking risk premiums in corporate bonds helped to offset the impact. Canadian investment grade was an outlier in the quarter, supported by the outperformance long term corporate bond spreads that was more than enough to overcome the negative impact from higher government bond yields.
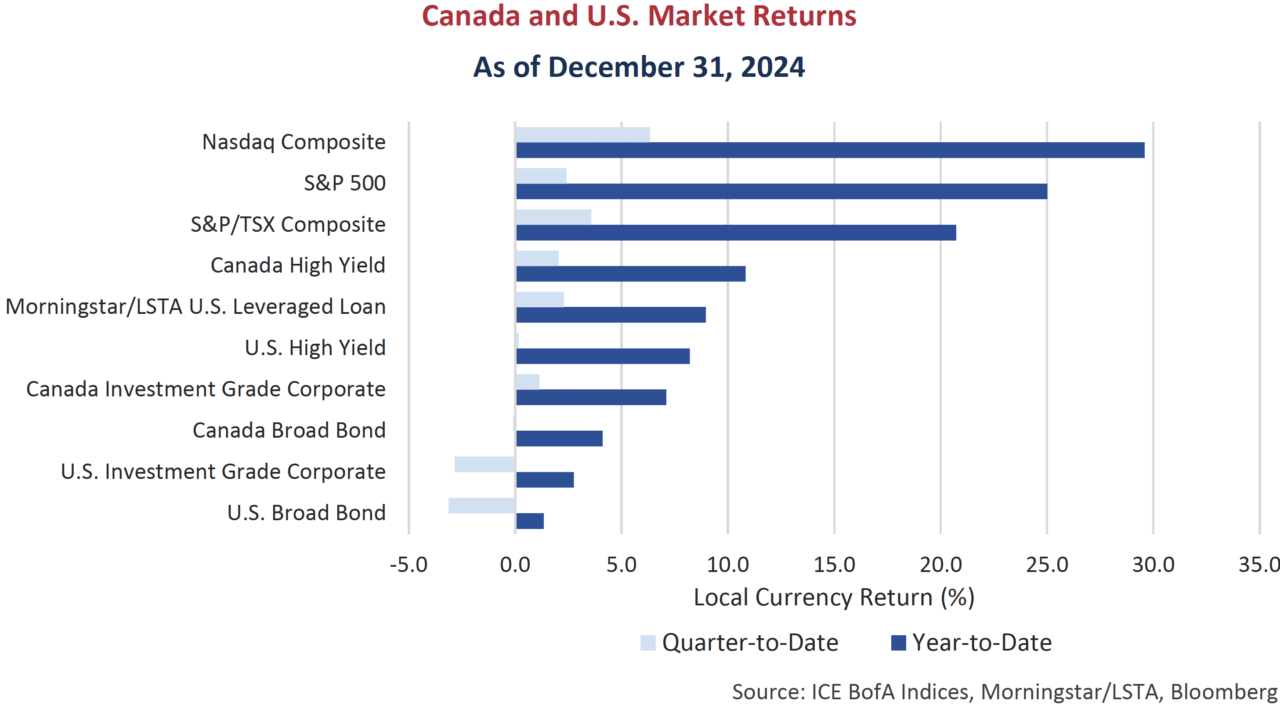
2024 was another blockbuster year for equities and a great year for credit, particularly high yield. Despite poor fourth quarter performance for U.S. bond markets, all indices ended the year up versus 2023. Equity and corporate credit carried its momentum with investors accepting increasingly expensive valuations. The risk of missing out on enduring strong performance kept cash flowing into the riskiest asset classes.
Corporate Action
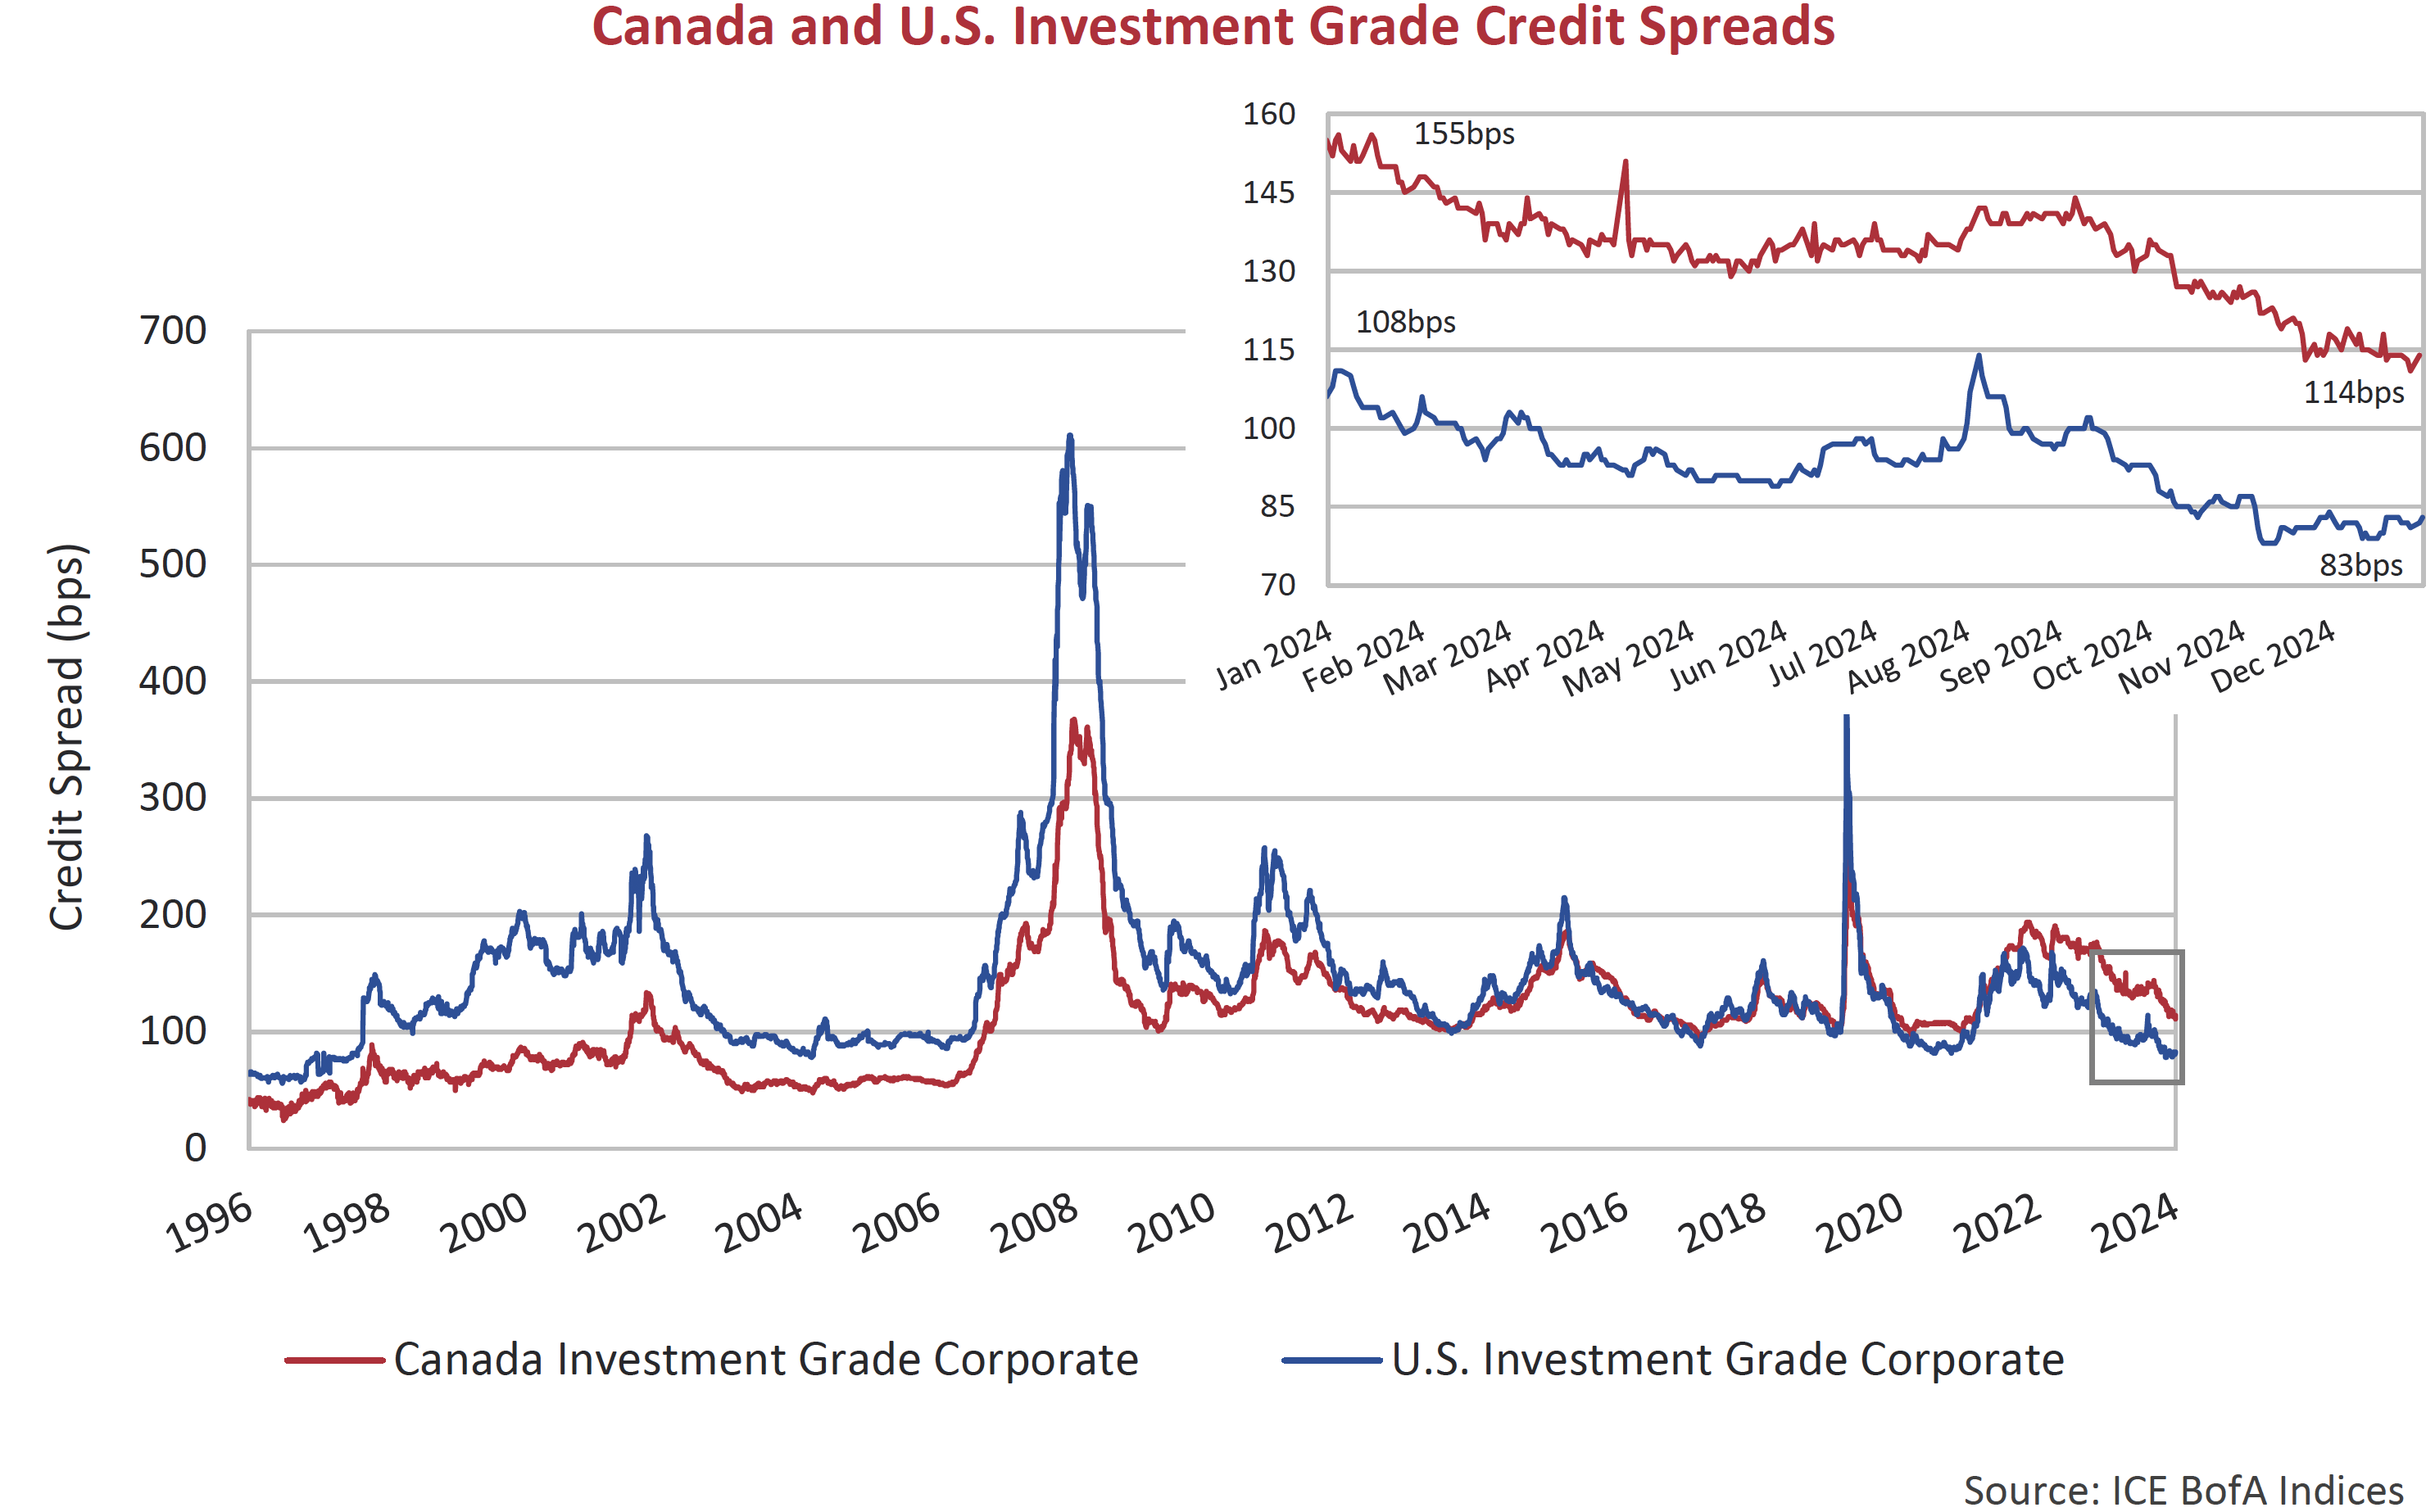
Tightening credit spreads drove strong performance in Canadian investment grade bonds. Canadian investment grade spreads tightened 18 bps in the fourth quarter and 37 bps for the full year. Lower quality BBB-rated issuers were the top performers in Canada with spreads tightening 54 bps in the year, well ahead of A-rated issuers at just 20 bps. The Canadian investment grade market also closed the gap with the U.S. with relative spread outperformance. Despite this, the dislocation between the markets continues to endure with the Canadian market offering better relative value on the surface.
Investors increasingly added credit risk in pursuit of the additional yield on offer in lower quality BBB-rated opportunities. Canadian grocer Metro Inc. highlighted the sentiment when it issued a 5-year senior unsecured bond in November at a credit spread of 81 bps, the tightest 5-year BBB spread on record. The paltry risk premium didn’t scare off investors as the order book was more than 4x oversubscribed.
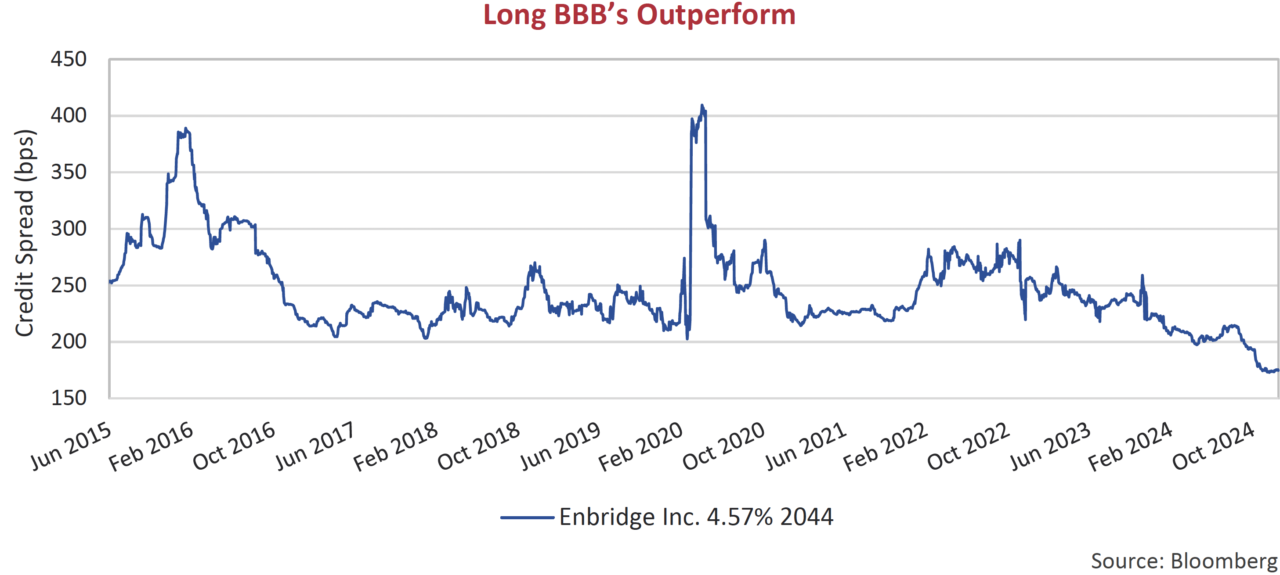
Shifting out the curve, below we plot the spread of a 2044 maturity Enbridge Inc. bond. Over the past decade, investors have generally demanded 2% to 3% in additional compensation over a Canada bond to hold the BBB rated issue. This relationship broke down in the fourth quarter as investors are now happy to receive well less than 200 bps of additional yield to hold the unsecured Enbridge bond. The chart looks similar for other BBB issuers as well, including TransCanada Pipelines, Loblaws and Rogers Communications, which have all tightened inside the 200 bps spread level. Not exactly screaming value in our estimation.
Tight Gas
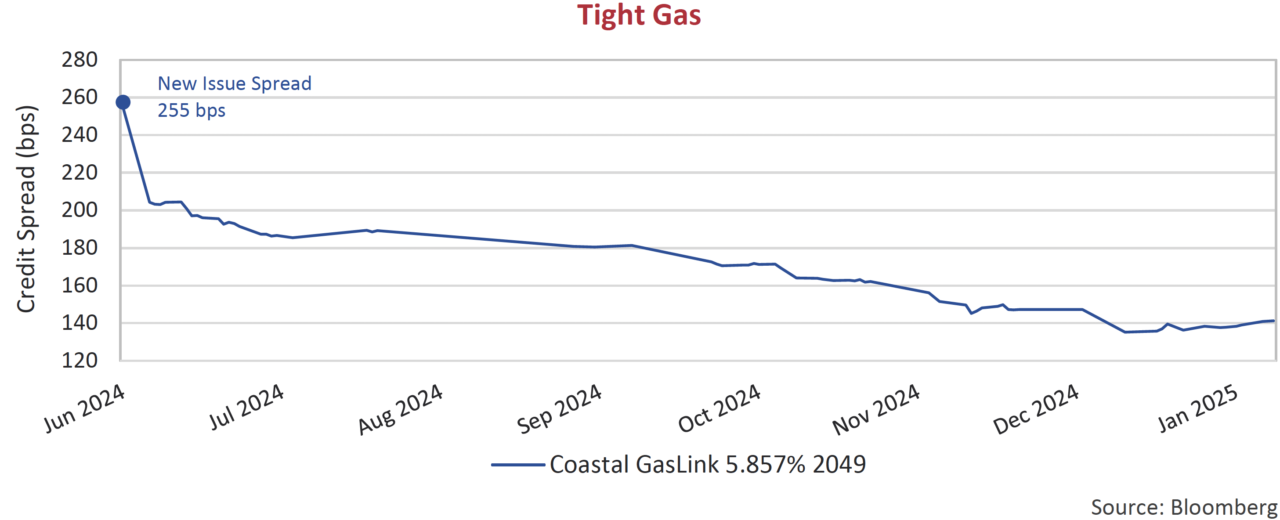
The largest corporate bond deal in Canadian history produced one of the most intriguing charts of 2024. Coastal Gas Link, which issued $7.15 billion of debt in June last year, experienced spectacular credit spread tightening post-issuance. Investor demand outstripped the record supply, sending credit spreads tighter and bond prices higher. The Coastal Gas Link 5.857% secured bond due 2049, the longest issue of the 11-tranche deal, tightened from 255 bps at new issue to 140 bps today. This translates to a 16% relative price gain in 7 months, extraordinary for an A- rated secured issue in relatively behaved markets.
Reset Expectations
Another top performer of 2024 were Limited Recourse Capital Notes (LRCNs). This junior ranking debt, issued by Canadian banks and insurance companies, ranks below senior and subordinated bonds, in line with preferred shares. A comeback story, these securities regained lost ground following significant declines over 2022-23. Within this subsegment, there was a marked outperformance of “low reset” issues versus “high reset” peers.
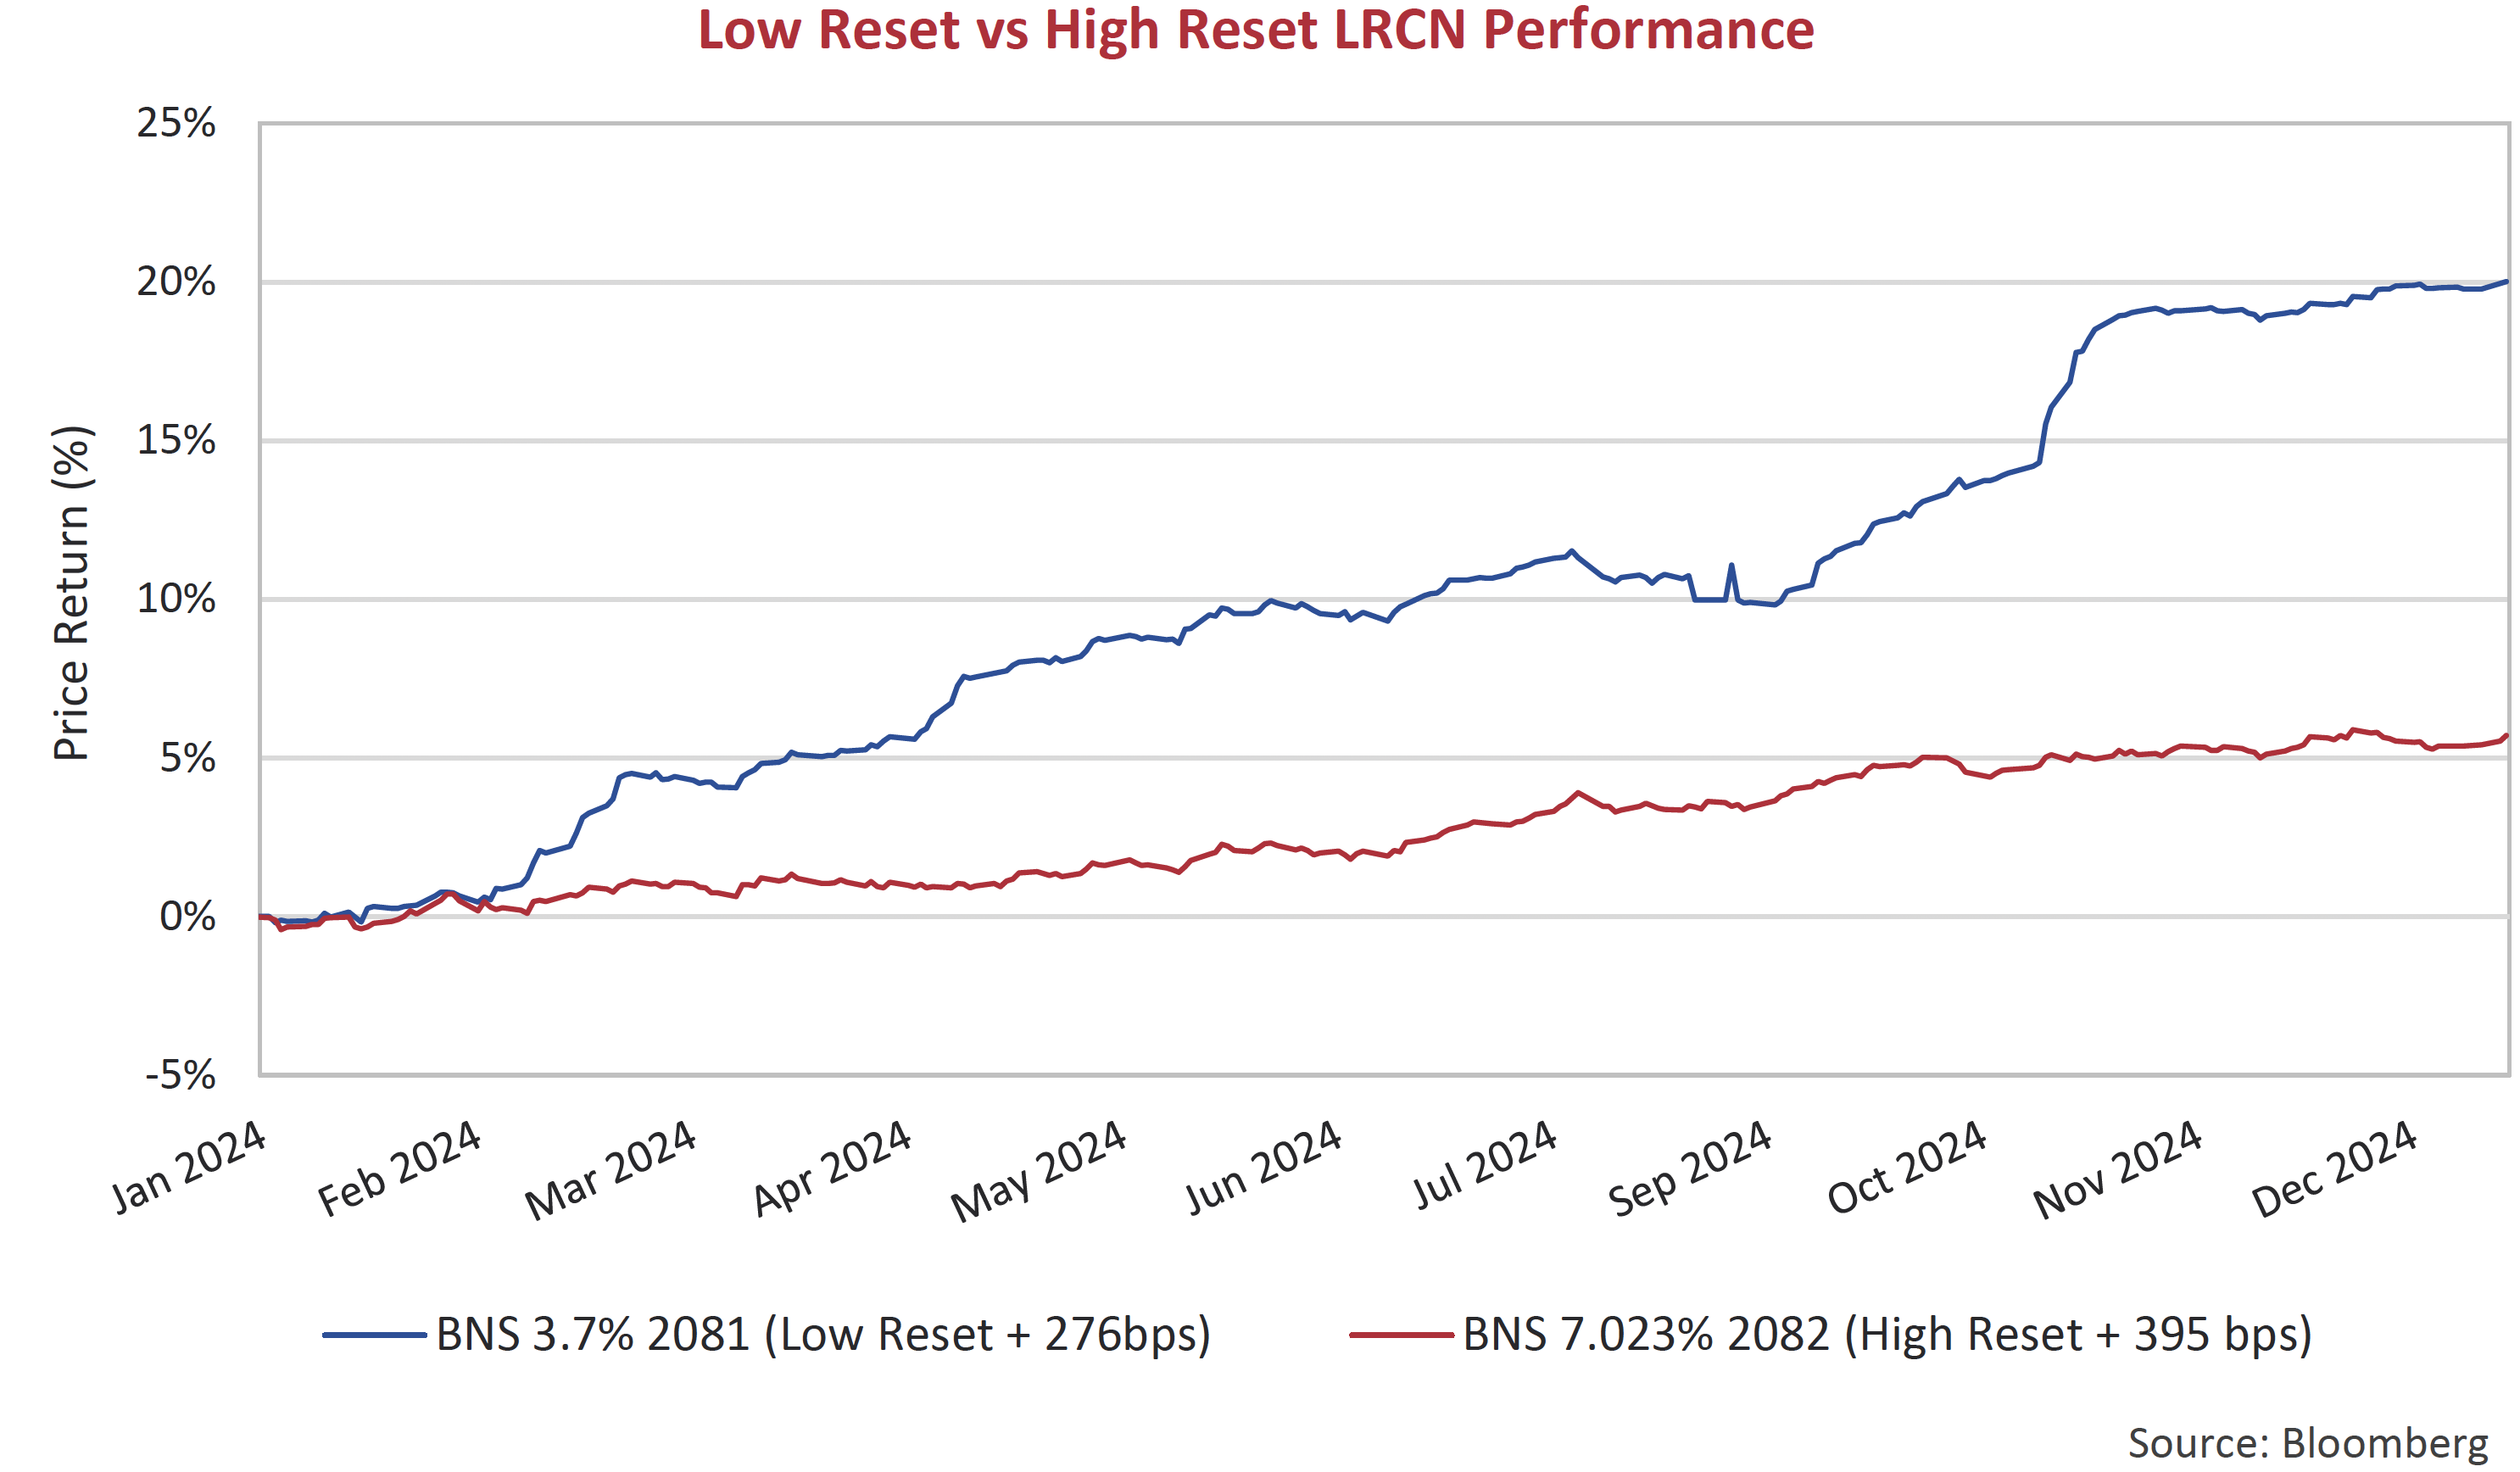
The typical structure of a Canadian LRCN is “60 non-call 5”, or “60 years to final maturity, but callable at par once every 5 years”. An important feature of these securities is the “reset spread”. Every 5 years, the issuer has the option to either call the bond at par, or, reset the coupon at the then prevailing 5-year GOC rate plus the “initial credit spread” (or “reset spread”). If the initial credit spread was high (“high reset”), the bank or insurance company is more likely to call the security when able to. If the initial credit spread was low (“low reset”), the issuer is less likely to exercise its call option, and the security will remain outstanding.
As these securities are relatively new to the Canadian market, we have seen “high resets” price at 400 bps and above, and “low resets” price at 300 bps and below. The problem the “low reset” LRCNs faced in 2022-23 was that credit spreads widened, reducing the likelihood these issues would be called on their first reset date. As a result, they began trading as longer dated bonds, negatively impacting their prices. But as credit spreads tightened throughout 2024, the probability of these “low reset” LRCNs being called increased, marching their prices back up.
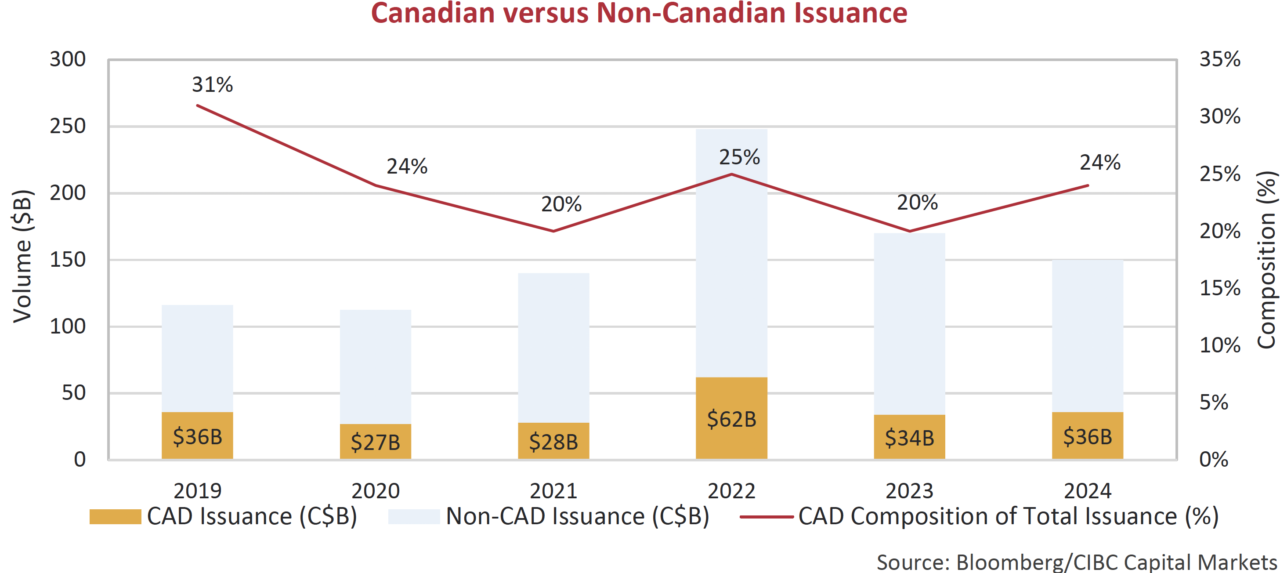
Global Borrowers
We point to an interesting chart from the FICC Strategy team at CIBC that highlights how significant global funding is for Canadian banks. When we look at our domestic corporate bond market, Canadian banks are by far the largest component, making up about one-quarter of the index. Despite this, it is interesting to note that Canadian banks only do a minority of their funding, about 20-25%, in our domestic market. The bulk of borrowing for Canadian banks actually occurs in the U.S. The depth of the U.S. market cannot be overstated. At 21x the size, the U.S. investment grade corporate bond market dwarfs its Canadian equivalent. In addition to this, pricing south of the border has recently been more favourable for Canadian banks, with select deals pricing 20 bps cheaper than Canadian market levels.
Still Not High on High Yield
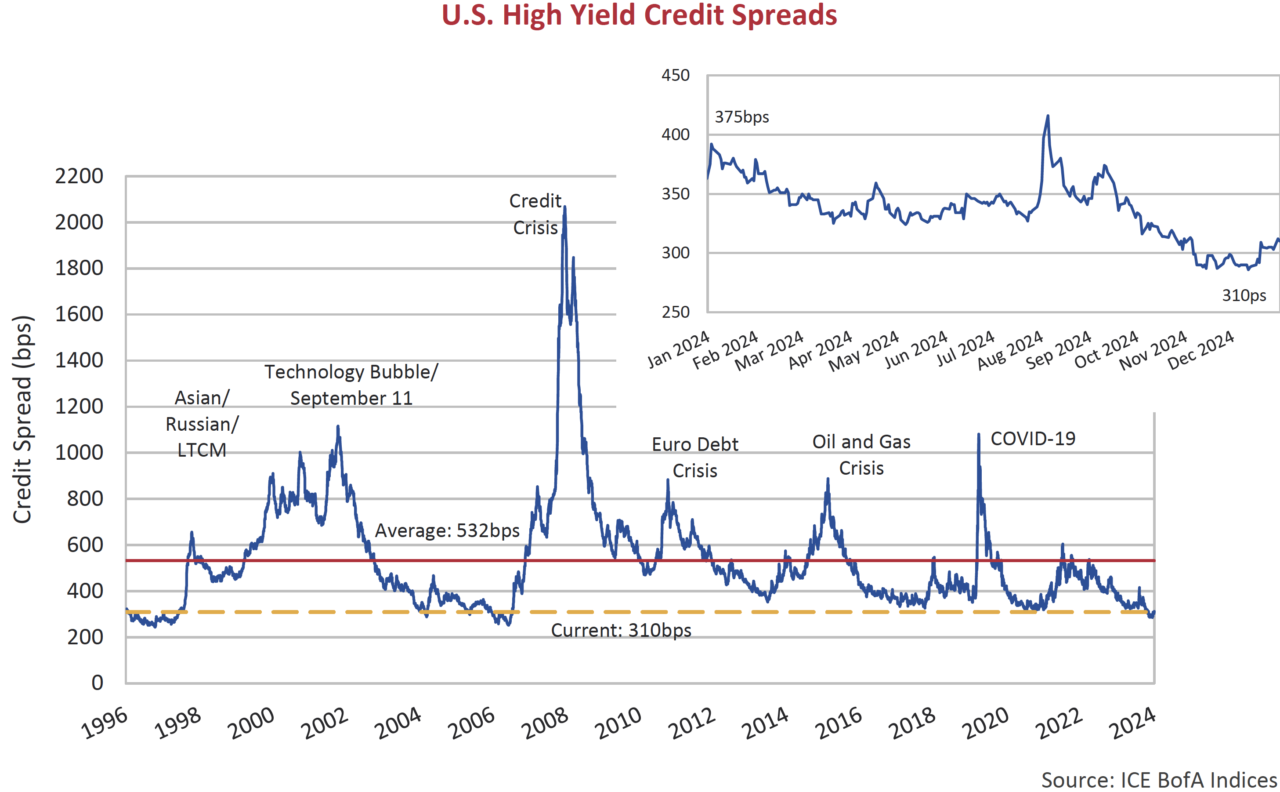
The appetite for credit risk also extended into the more speculative ends of credit markets. High yield credit spreads continued to move tighter during the final quarter of 2024. Spreads on the high yield bond index started the quarter at 330 bps and hit a low of 286 bps in early December before settling just outside 300 bps where they remain. For the year, spreads were 53 bps tighter in 2024, which comfortably outperformed high quality corporates in the U.S. high yield spreads have now pushed through previous cycle tights to levels not seen since 2006 with investors willing to accept less and less compensation for the credit risk.
From Ebbs to Flows
High yield bond issuers sought to take advantage of the historically tight risk premiums in the new issue market. Tighter credit spreads resulted in lower borrowing costs for most issuers. The graph below from PitchBook Data, Inc. plots new issue volumes in the U.S. high yield market. In 2024, more than US$280 billion was placed in the market, which is more than the combined annual totals in 2023 and 2022. This total remains modest relative to the unprecedented amount of issuance during the pandemic-era.
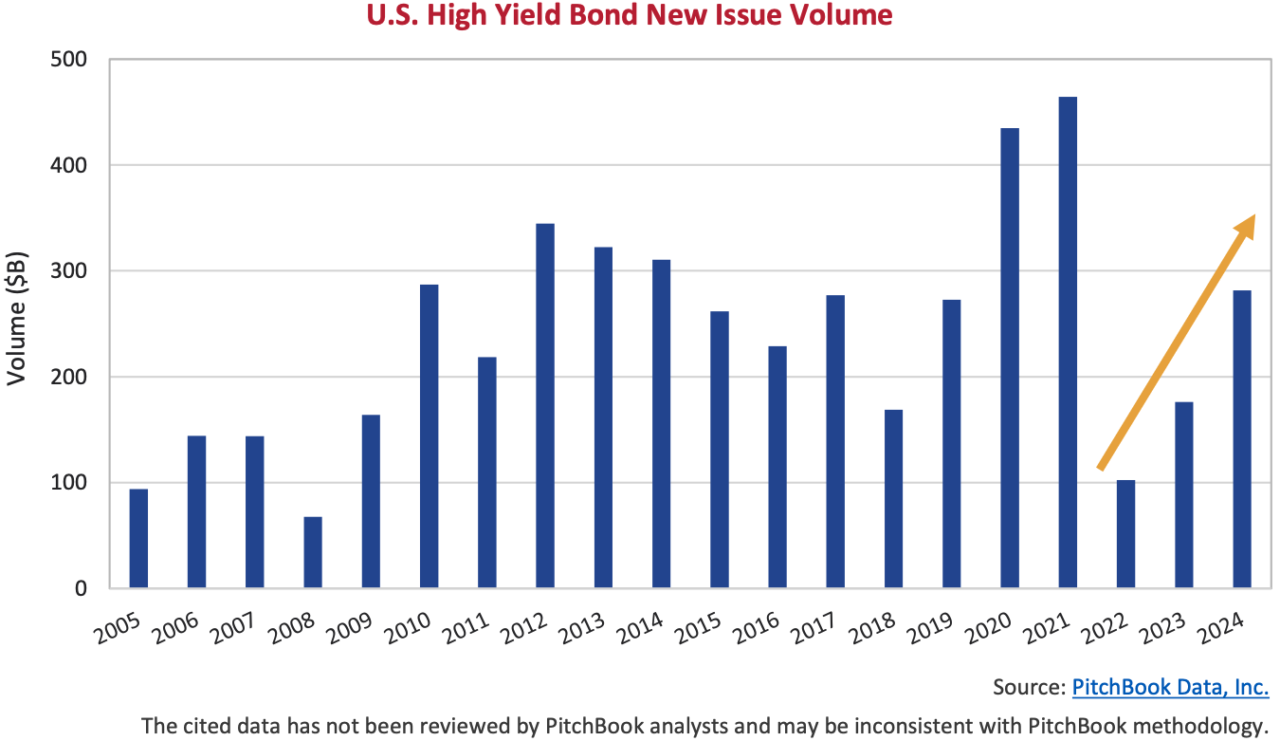
It is not surprising that lower borrowing costs and accommodative markets resulted in a significant proportion of issuance to support refinancing of outstanding debt. The conditions were right for issuers to opportunistically push out their maturities. According to data from PitchBook Data, Inc., refinancing activity accounted for 70% of the new issue volumes. This was even more pronounced in the leveraged loan market where repricing and refinancing activity led to historic gross issuance levels for loans in 2024. However, the new issuance volumes, net of refinancing, were once again quite modest this year. This means that there was limited new supply placed in the market and yield hungry investors continued to accept less compensation for their investments.
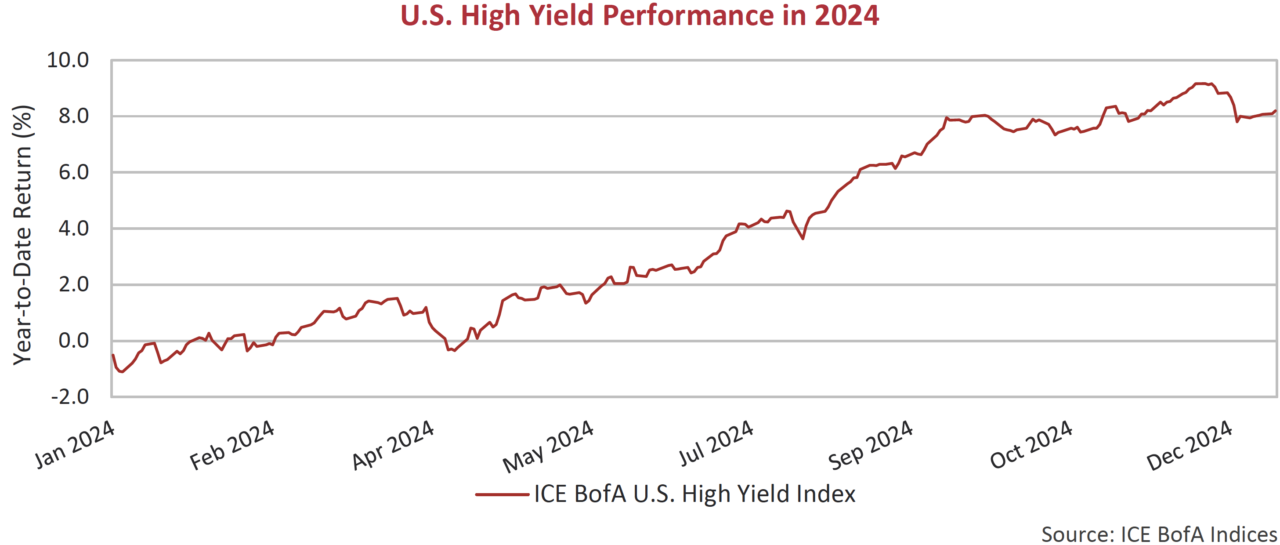
Best Around
Below we have plotted the cumulative return for the high yield market during 2024. The graph shows that high yield investors enjoyed returns that pushed steadily higher through the year. Tighter spreads drove returns in excess of what many predicted would be a more subdued result closer to the running yield of 7.7% at the time. Credit spread tightening added to that yield, and also offset the negative impact of higher government bond yields.
After another strong year, a repeat performance in 2025 is going to be difficult. To capture the 7.4% yield of the high yield market, investors need to push further down the credit curve into lower quality issues. The highest quality BB-rated issues, which make up more than half of the index, now have an average credit spread approaching 200 bps, which results in a yield of 6.4%. Low default rates are likely to provide comfort and confidence for investors to push down into lower quality B rated issues, which carry a yield close to the market index.
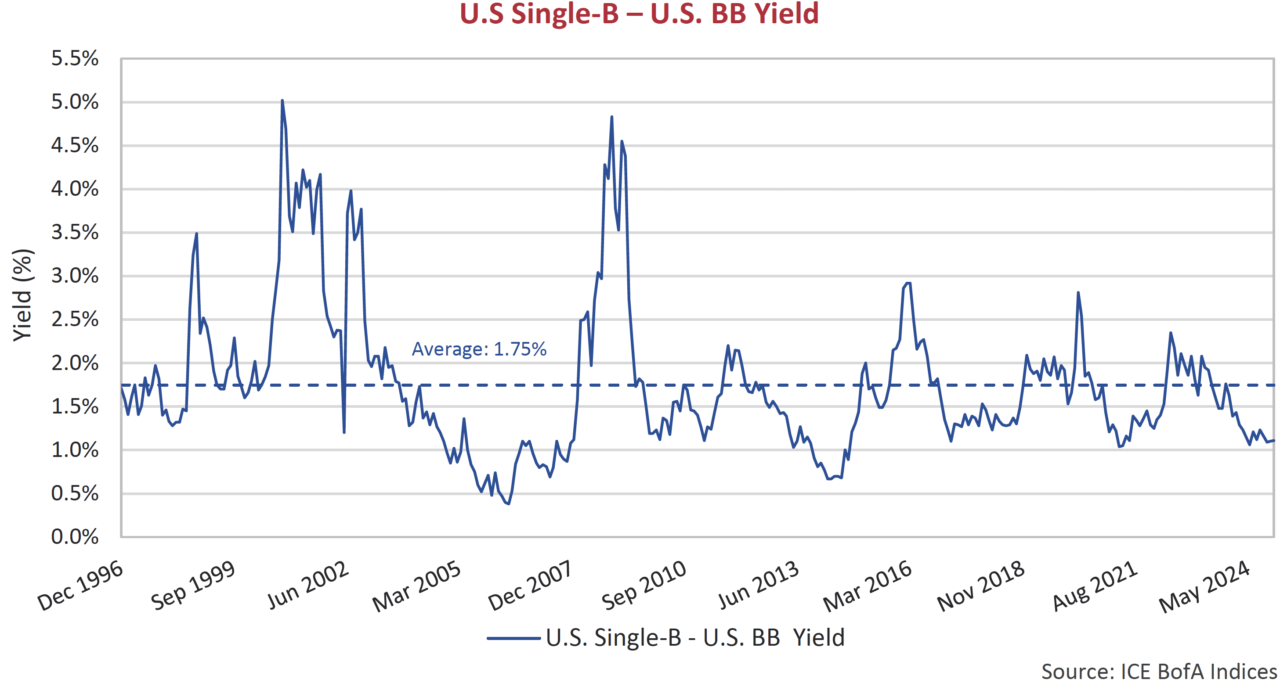
Reaching For Yield
Below we have plotted the yield basis between B and BB rated issues in the high yield index. The graph illustrates that the difference in yields is towards cycle lows. This means investors are receiving less extra yield for the incremental credit risk. We believe that reaching for yield is always dangerous and that at current valuations, investors should be focused on a discriminate approach to ensure compensation for credit risk. We are not confident that will be the case.
Below the Surface
The low rate of defaults that is providing confidence to investors sits against a continuing rise in liability management exercises “LMEs” or “Distressed Exchanges”. Previously only used as a last-ditch effort to avert bankruptcy, the practice is becoming commonplace long before issuers’ backs are up against the wall. Companies experiencing difficulties or that have debt trading at a discount to par are reacting opportunistically and at the expense of existing lenders.
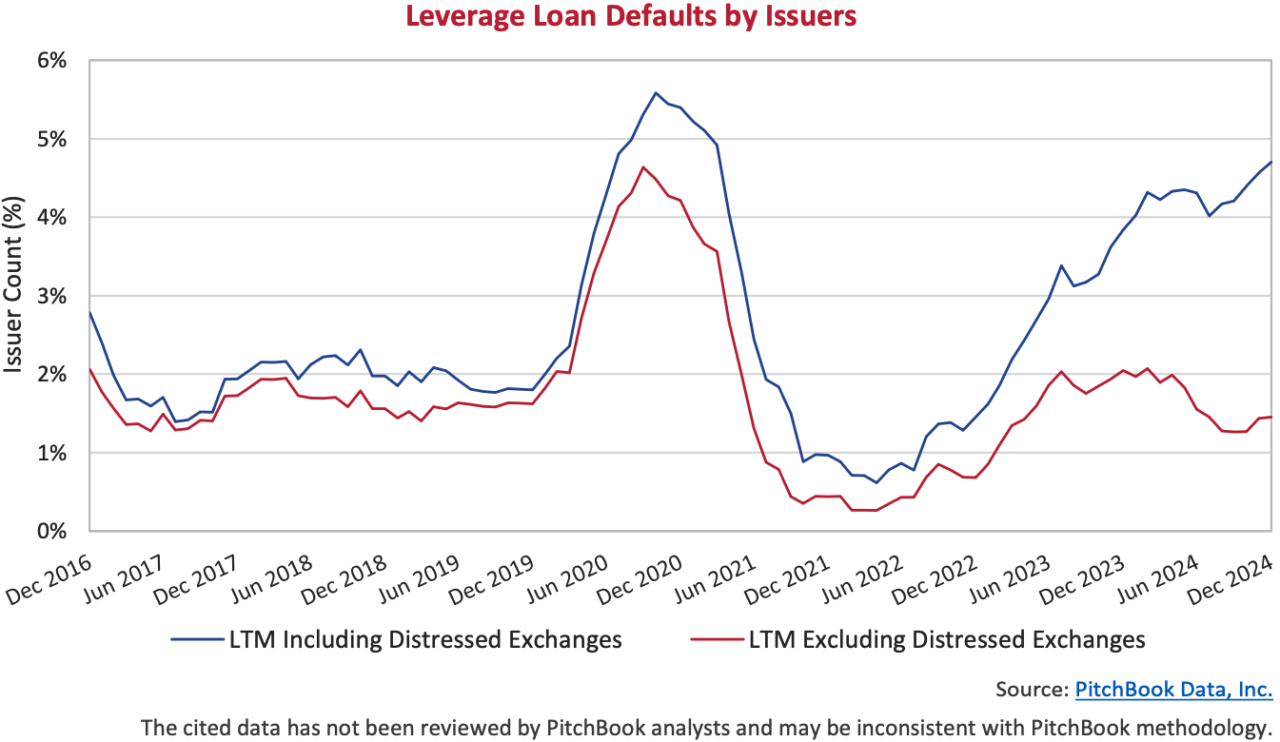
On The Horizon
We view the continued divergence in the above chart as a warning sign. It illustrates credit stress below the surface and more importantly is the result of weak deal underwriting. In a recent report titled “Lens on Loopholes Q4’24”, the Covenant Review team performs a broad market analysis which highlights that the same deal structures that have provided flexibility for LMEs in the past are present in a high percentage of issues still outstanding today. We are steadfast in our belief that it is as important as ever to understand the risks on which you are lending. At current valuations, the upside is likely your running yield and the potential for very modest additional spread compression. The downside, on the other hand, is significant. In this market environment, outside of special situations, we will continue to favour quality and liquidity until paid for the risks.