To the Moon
We celebrate the successful completion of the Artemis II space mission that sent 4 astronauts farther away from Earth than any human had previously travelled. London, Ontario-born Jeremy Hansen represented the Canadian Space Agency and became the first non-American to travel outside of low Earth orbit. Jeremy is a Royal Military College of Canada (RMC) graduate, Diamond Jubilee Medal recipient and Royal Canadian Air Force colonel. A truly proud moment for Jeremy and for Canada, Jeremy represents all the qualities we strive to achieve.
Rocket Man
Forever a marketer, Elon Musk filed Initial Public Offering (IPO) paperwork for his company SpaceX on the day of the Artemis II launch. The confidential filing initiates a public listing process which Musk is targeting to be the largest in history, aiming to raise US$75 billion on a US$1.75 trillion valuation. SpaceX’s offering combines a rocket launching business, the Starlink satellite communications network and the Artificial Intelligence (AI) startup xAI. The combined entity is rumoured to generate approximately US$25 billion of revenue this year, pinning the valuation at a 70x revenue multiple. The marketing roadshow is expected to kick off in June and will be targeting a higher percentage of retail investors relative to other mega-IPO’s. Musk won’t be focusing prospective investors on current figures. As we have seen with ventures past, Musk will be selling those investors a dream of the future.
Dire Straits
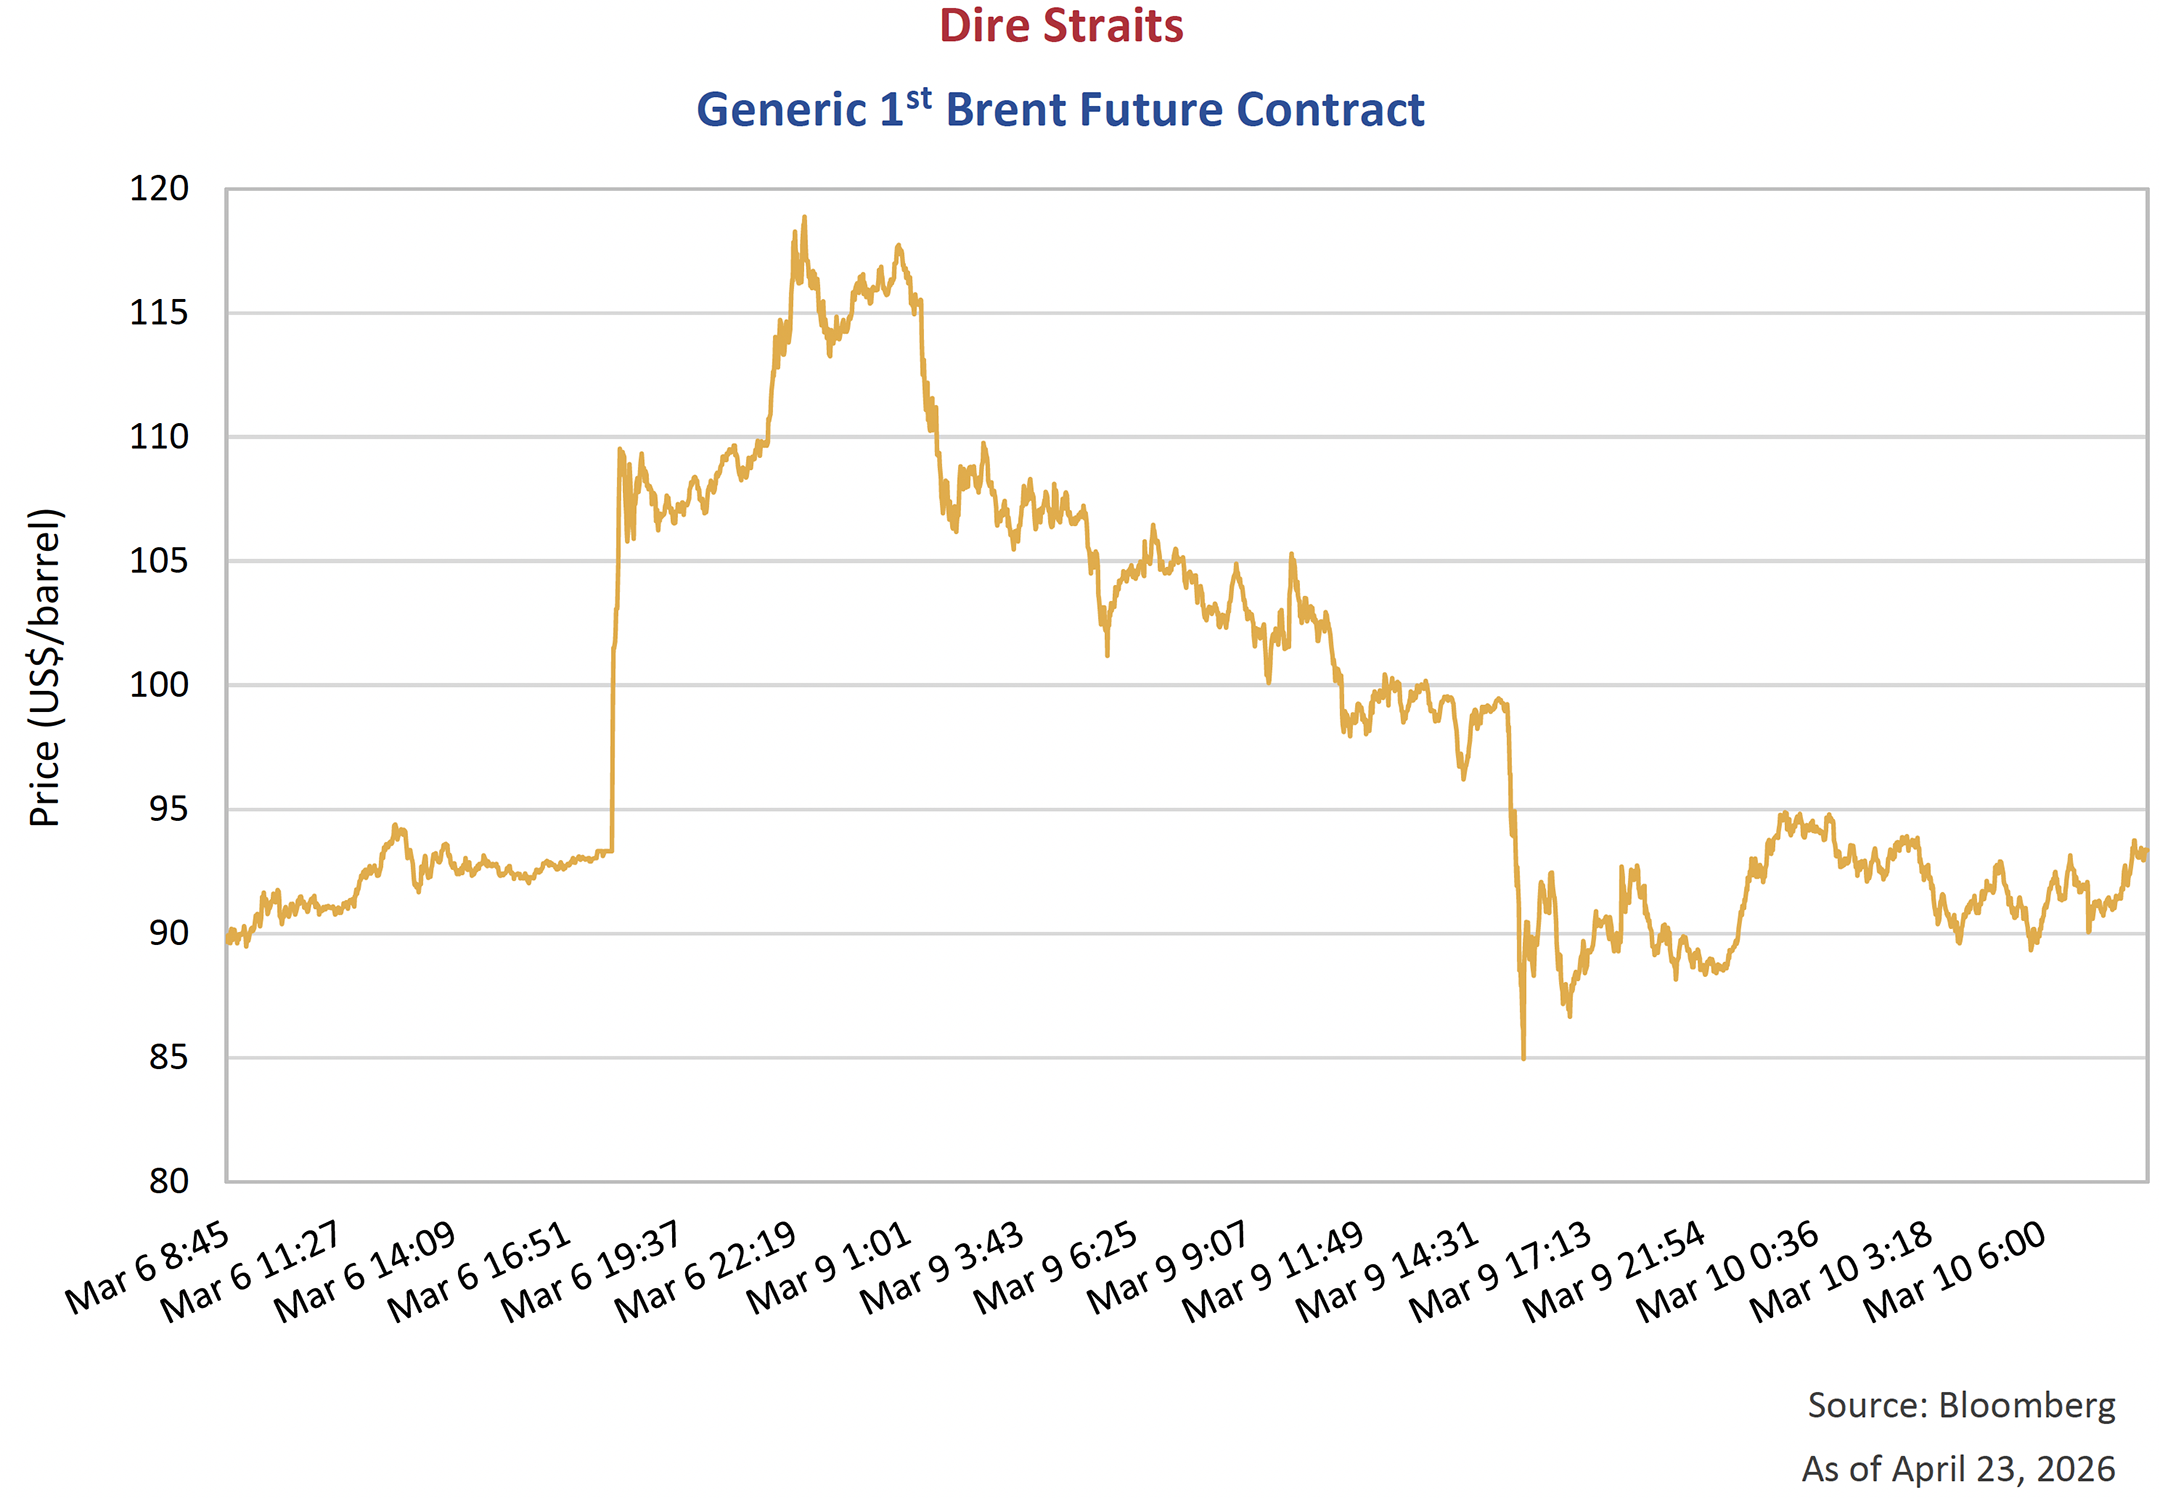
Oil markets were rocked following President Trump’s initial strikes on Iran. Global benchmark levels quickly rose over 60% in price, surpassing US$100/barrel for the first time since July 2022. As the U.S. and Iran grapple over the Strait of Hormuz, the price of oil continues to whipsaw. Investors are actively assessing the length of the conflict, damage to infrastructure in the region, and the supply response from other areas globally.
The on-again, off-again nature of the Strait of Hormuz blockade is having volatile impacts on prices. Over the span of the conflict, we have seen 12 days where the price of a barrel has moved more than 5% in a day. Especially notable, and which we highlight below, was the price action following the weekend of March 7th – 8th. The Generic 1st Brent Futures contract reopened Sunday night and quickly rose US$26 above where it had closed on Friday. By Monday morning, the price was still elevated, but by the time traders in New York went to dinner on Monday night, this contract had fully “roundtripped” and was sitting below Friday’s closing level. A remarkable move of US$55 dollars over the day.
The market is on a knife’s edge guessing where the next decision will land. Open the Strait and unlock a barrage of petroleum waiting to hit markets, and the price will likely plunge. Keep the Strait closed and threaten damage to regional infrastructure, and the price is sure to spike. The belief is that the current price is reflecting a binary outcome where oil will be either much higher, or much lower, depending on the outcome of the war. Nevertheless, there is little debate about the long-term impact of higher energy prices on inflation. The bond market is acknowledging this dire position.
Sultans of Swing
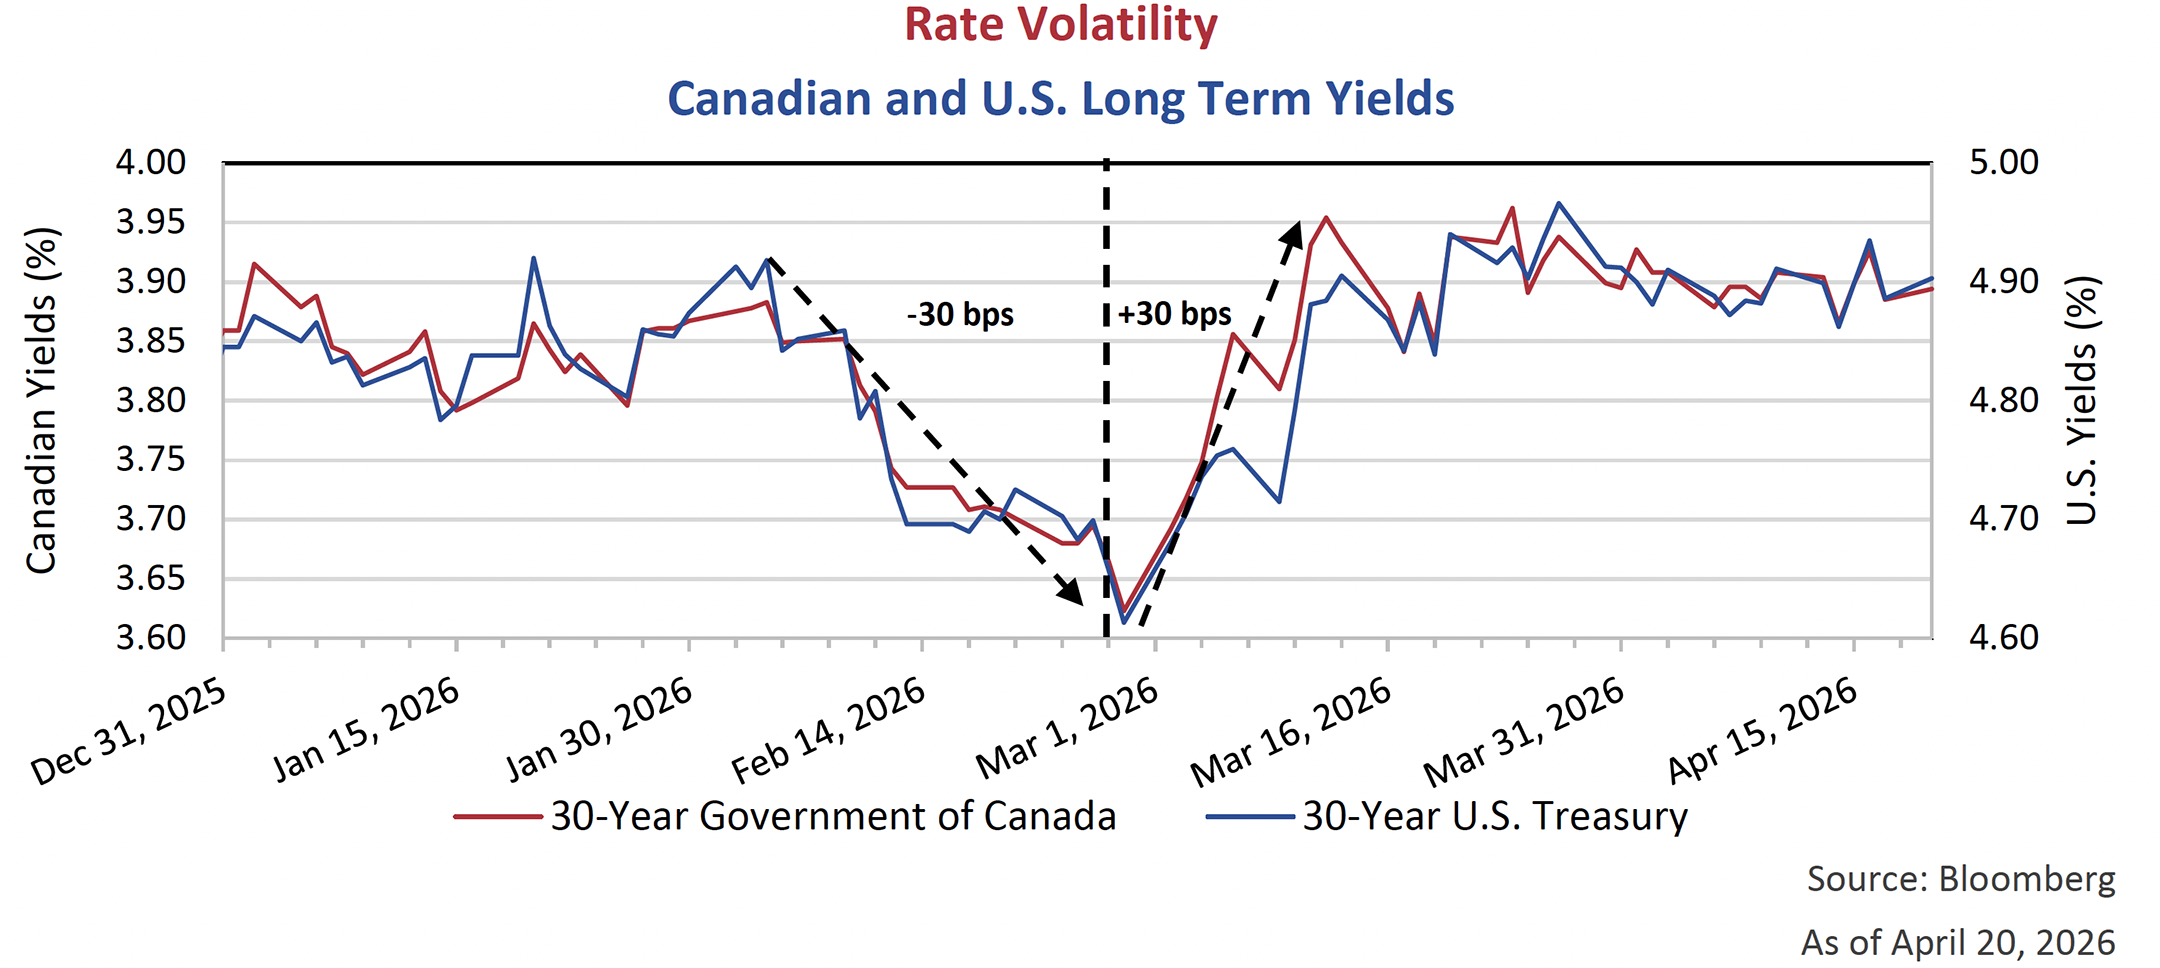
Government bond yields have also reacted sharply to the conflict. Below we plot the movement in Canadian and U.S. long-bonds. Through to the end of February, yields fell as investors increasingly sought safety in bonds. Sentiment shifted in March with the escalation of the conflict and yields quickly reverted with a pronounced move higher. Investors reacted to the longer-term impact of high energy prices and the inflationary effects of war. Shorter term government bond yields also moved higher, with investors paring back their projection for several central banking cuts this year. The market is now only pricing in 1 cut in the U.S. for 2026, while the Canadian market has completely flipped from a cut in 2026 to a hike.
Into The Mystic
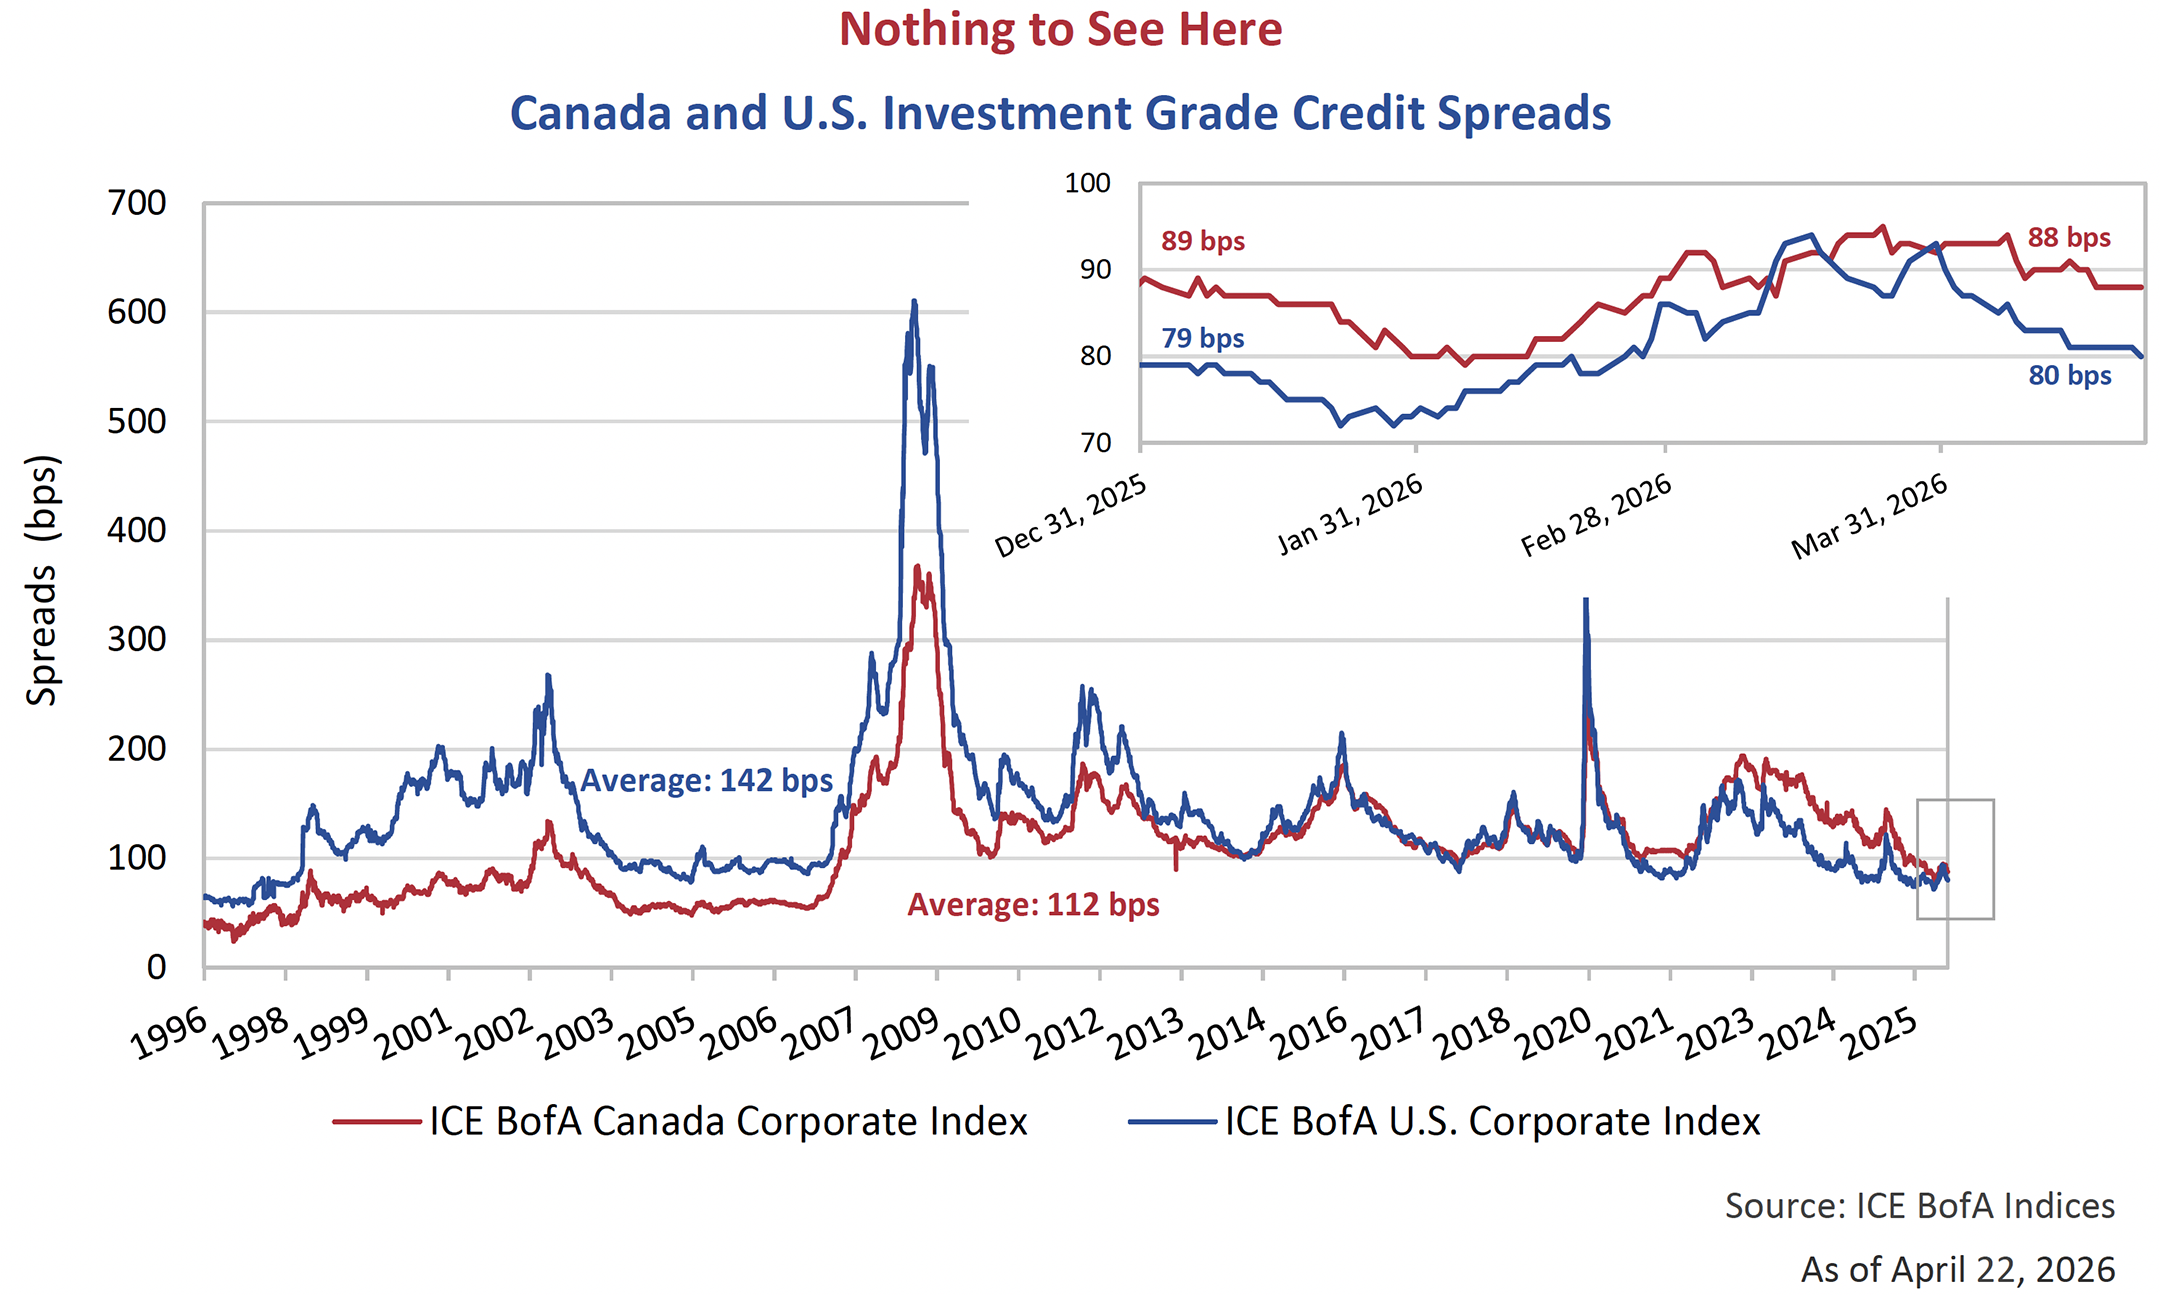
Despite all the volatility across capital markets so far this year, risk premiums on corporate bonds have not materially repriced. Below we look at the change in investment grade credit spreads over the first quarter, and we can see the muted reaction. Canadian spreads moved wider by 4 basis points (bps), to end March 31st at 93 bps, whereas U.S. spreads were out 11 bps to finish the quarter at 90 bps. Since then, spreads have rallied back to where they began the year. All the while, corporate bond markets have absorbed significant levels of new issuance, including some historically large debt financings in the U.S. Investment grade credit spreads remain historically tight, with Canadian spreads sitting approximately 20 bps inside their long-term average, and U.S. spreads 50 bps inside.
The Bottom Line
Benefiting from the surge in commodity prices, the S&P/TSX Composite Index led the charge to start the year and continues to outperform major global benchmarks. The Canadian equity benchmark is riding a “real assets” tailwind, combined with a relatively heavy weighting to financials and other cyclicals. Following a 31% gain in 2025, the TSX extended its rally into the first quarter of 2026, rising a further 3.8%. In contrast, U.S. equities declined over the same period, with the S&P 500 and Nasdaq falling approximately 5% and 7%, respectively, marking the S&P 500’s weakest quarterly performance since 2022. The drawdown didn’t last long, with equity markets rallying in April back to new record levels.
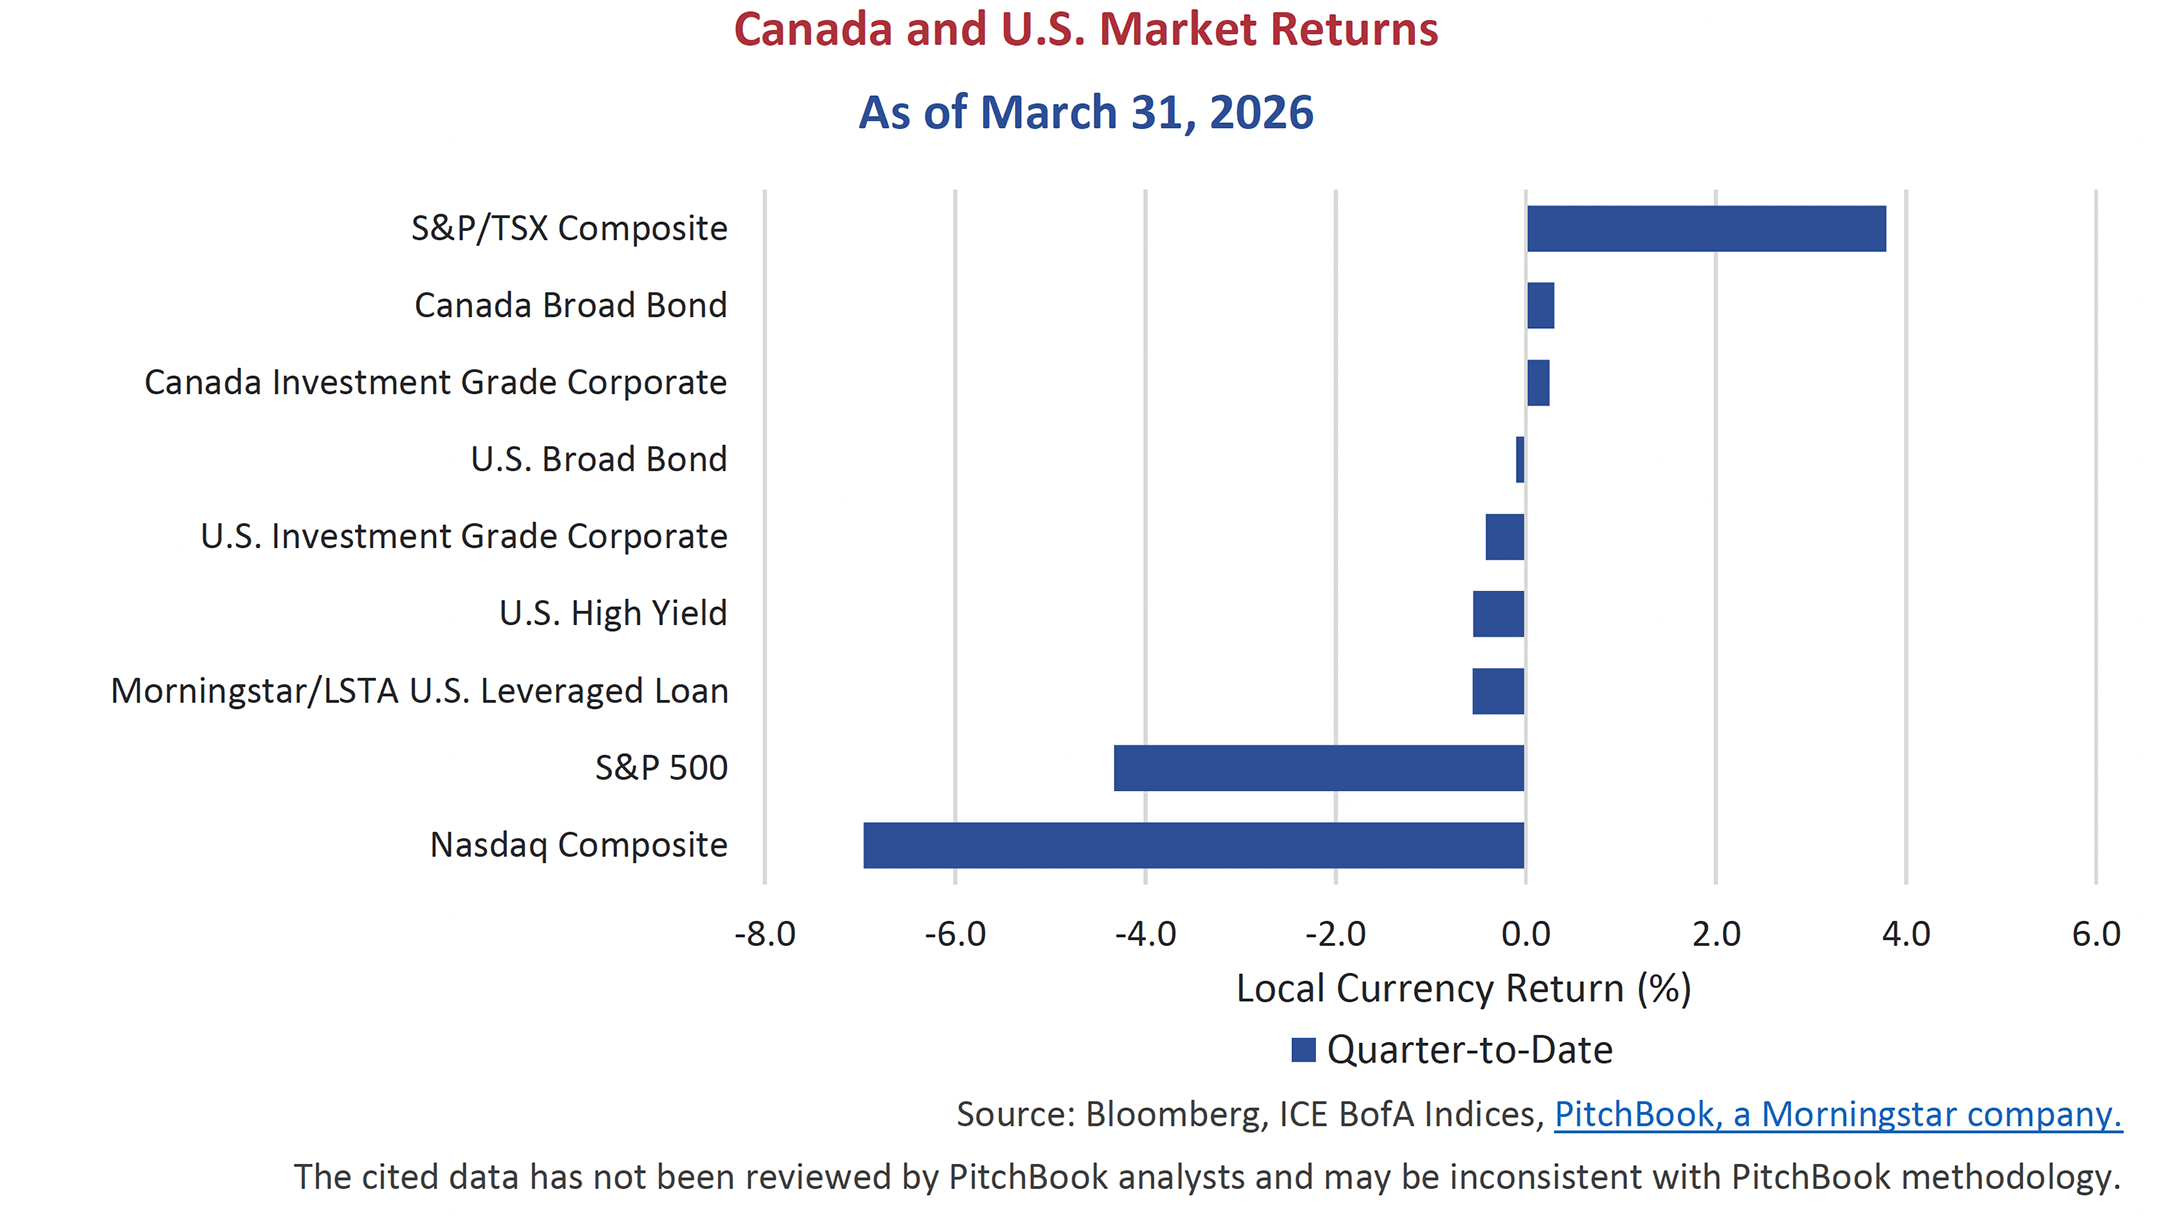
A similar pattern was evident in fixed income markets, where Canadian indices outperformed their U.S. counterparts in the first quarter. Both the broad Canadian bond market and Canadian investment grade corporate bond market delivered modestly positive returns, while equivalent U.S. indices posted slightly negative performance. Bond yields rose sharply in both markets, reversing declines across the curve earlier in the year. However, Canadian yields were more anchored than those in the U.S. High yield and leveraged loan indices were the weakest performers in fixed income in the first quarter of 2026, as credit spread widening was more pronounced than in investment grade.
Call Me Maybe
Limited Recourse Capital Notes (LRCNs) were introduced into the Canadian market in the summer of 2020. These securities have a unique structure with a long final maturity date (60+ years), and a 5-year reset structure, where issuers can call at par, or reset the coupon based on the then prevailing 5-year Government of Canada yield plus a fixed initial credit spread. The thinking goes, if the issuer can sell a new junior security into the market at a lower “reset spread”, then it makes sense to call the existing LRCN, and replace it with a newly issued, cheaper version.
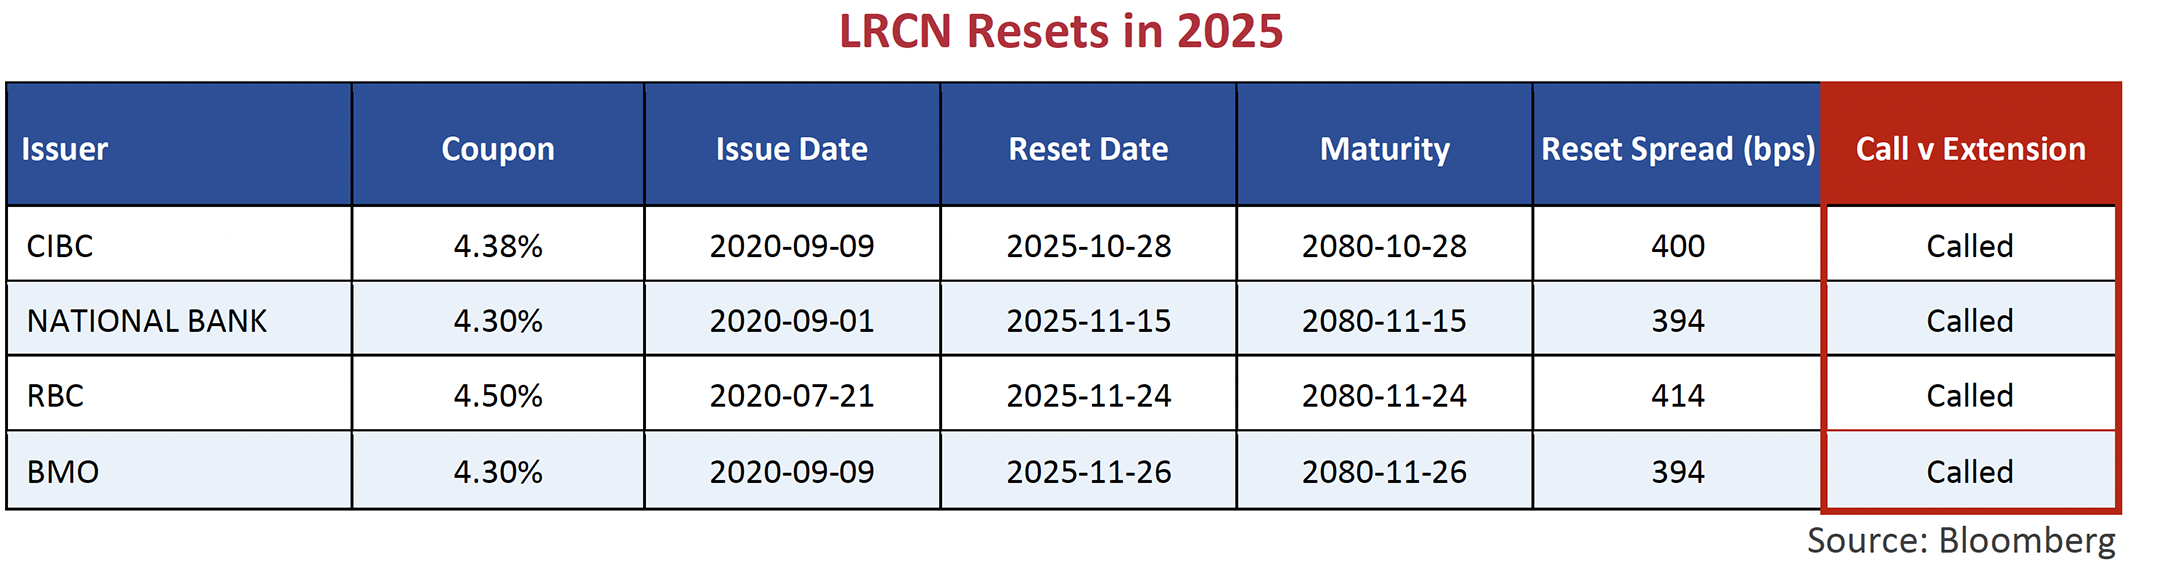
Last summer, we discussed reset expectations for the first cohort of LRCNs issued in 2020 as they approached their initial reset dates. Reset spreads for those early issues ranged from 394 bps to 414 bps. This exceeded comparable new issuance levels, which led us to expect that issuers were very likely to call their bonds. Indeed, all four of these issues were called.
Call decisions continue to be tested for the LRCNs that were issued in late 2020/2021. So far in 2026, three LRCNs have hit their call dates. RBC called their Canadian LRCN with a reset spread of 362 bps and have been successfully raising AT1 capital in the U.S. In February, Intact called their LRCN with a 320 bps reset spread and replaced it with a new issue carrying a reset spread of 275 bps. Conversely, Empire Life opted not to call their only outstanding LRCN, that carries a reset spread of 308 bps, and instead decided to extend the issue. Empire Life’s failure to call was not entirely expected given the current pricing in the market, but given the rise in the 5-year Canada bond since 2021, from 0.54% to 3.10%, the cash coupon reset from 3.625% to 6.177% for the next 5 years.
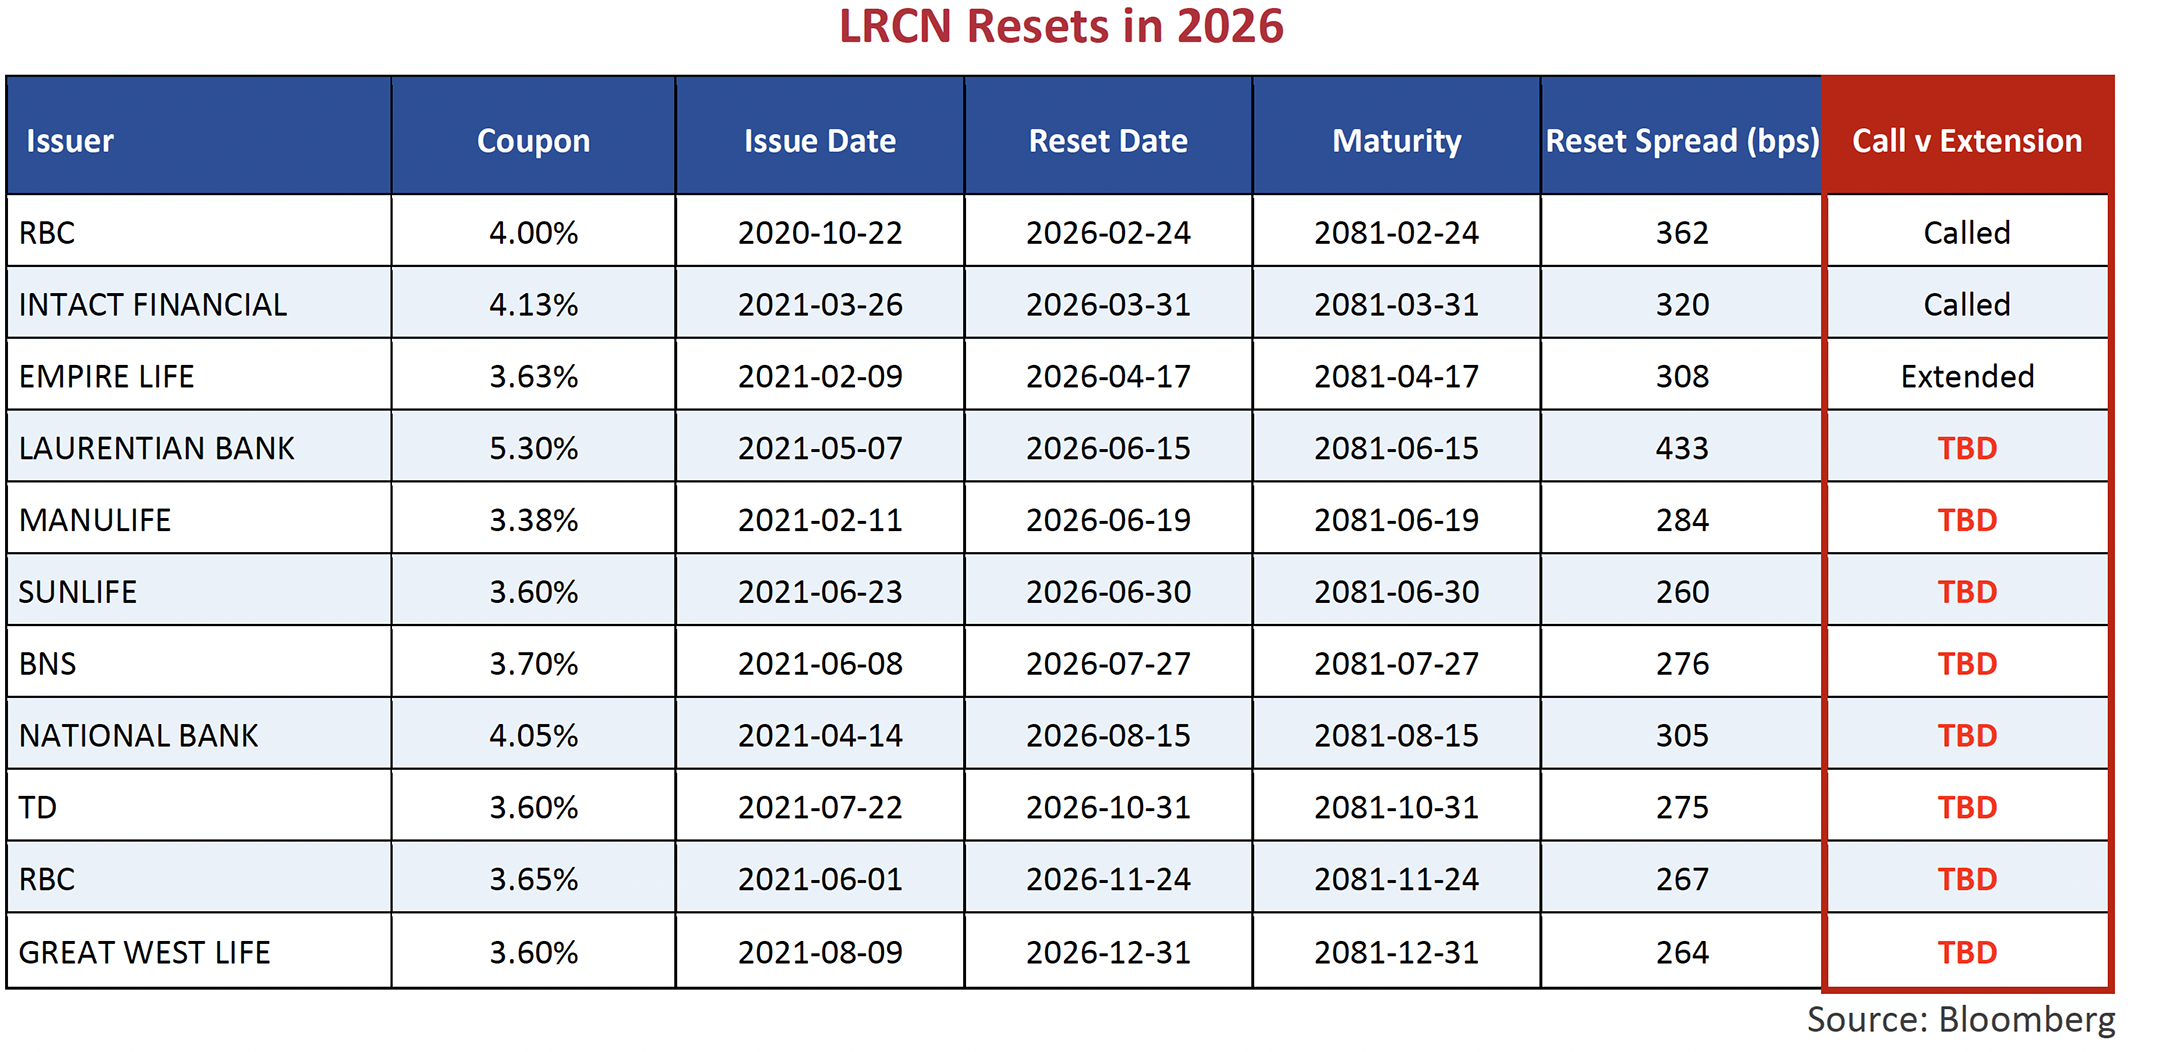
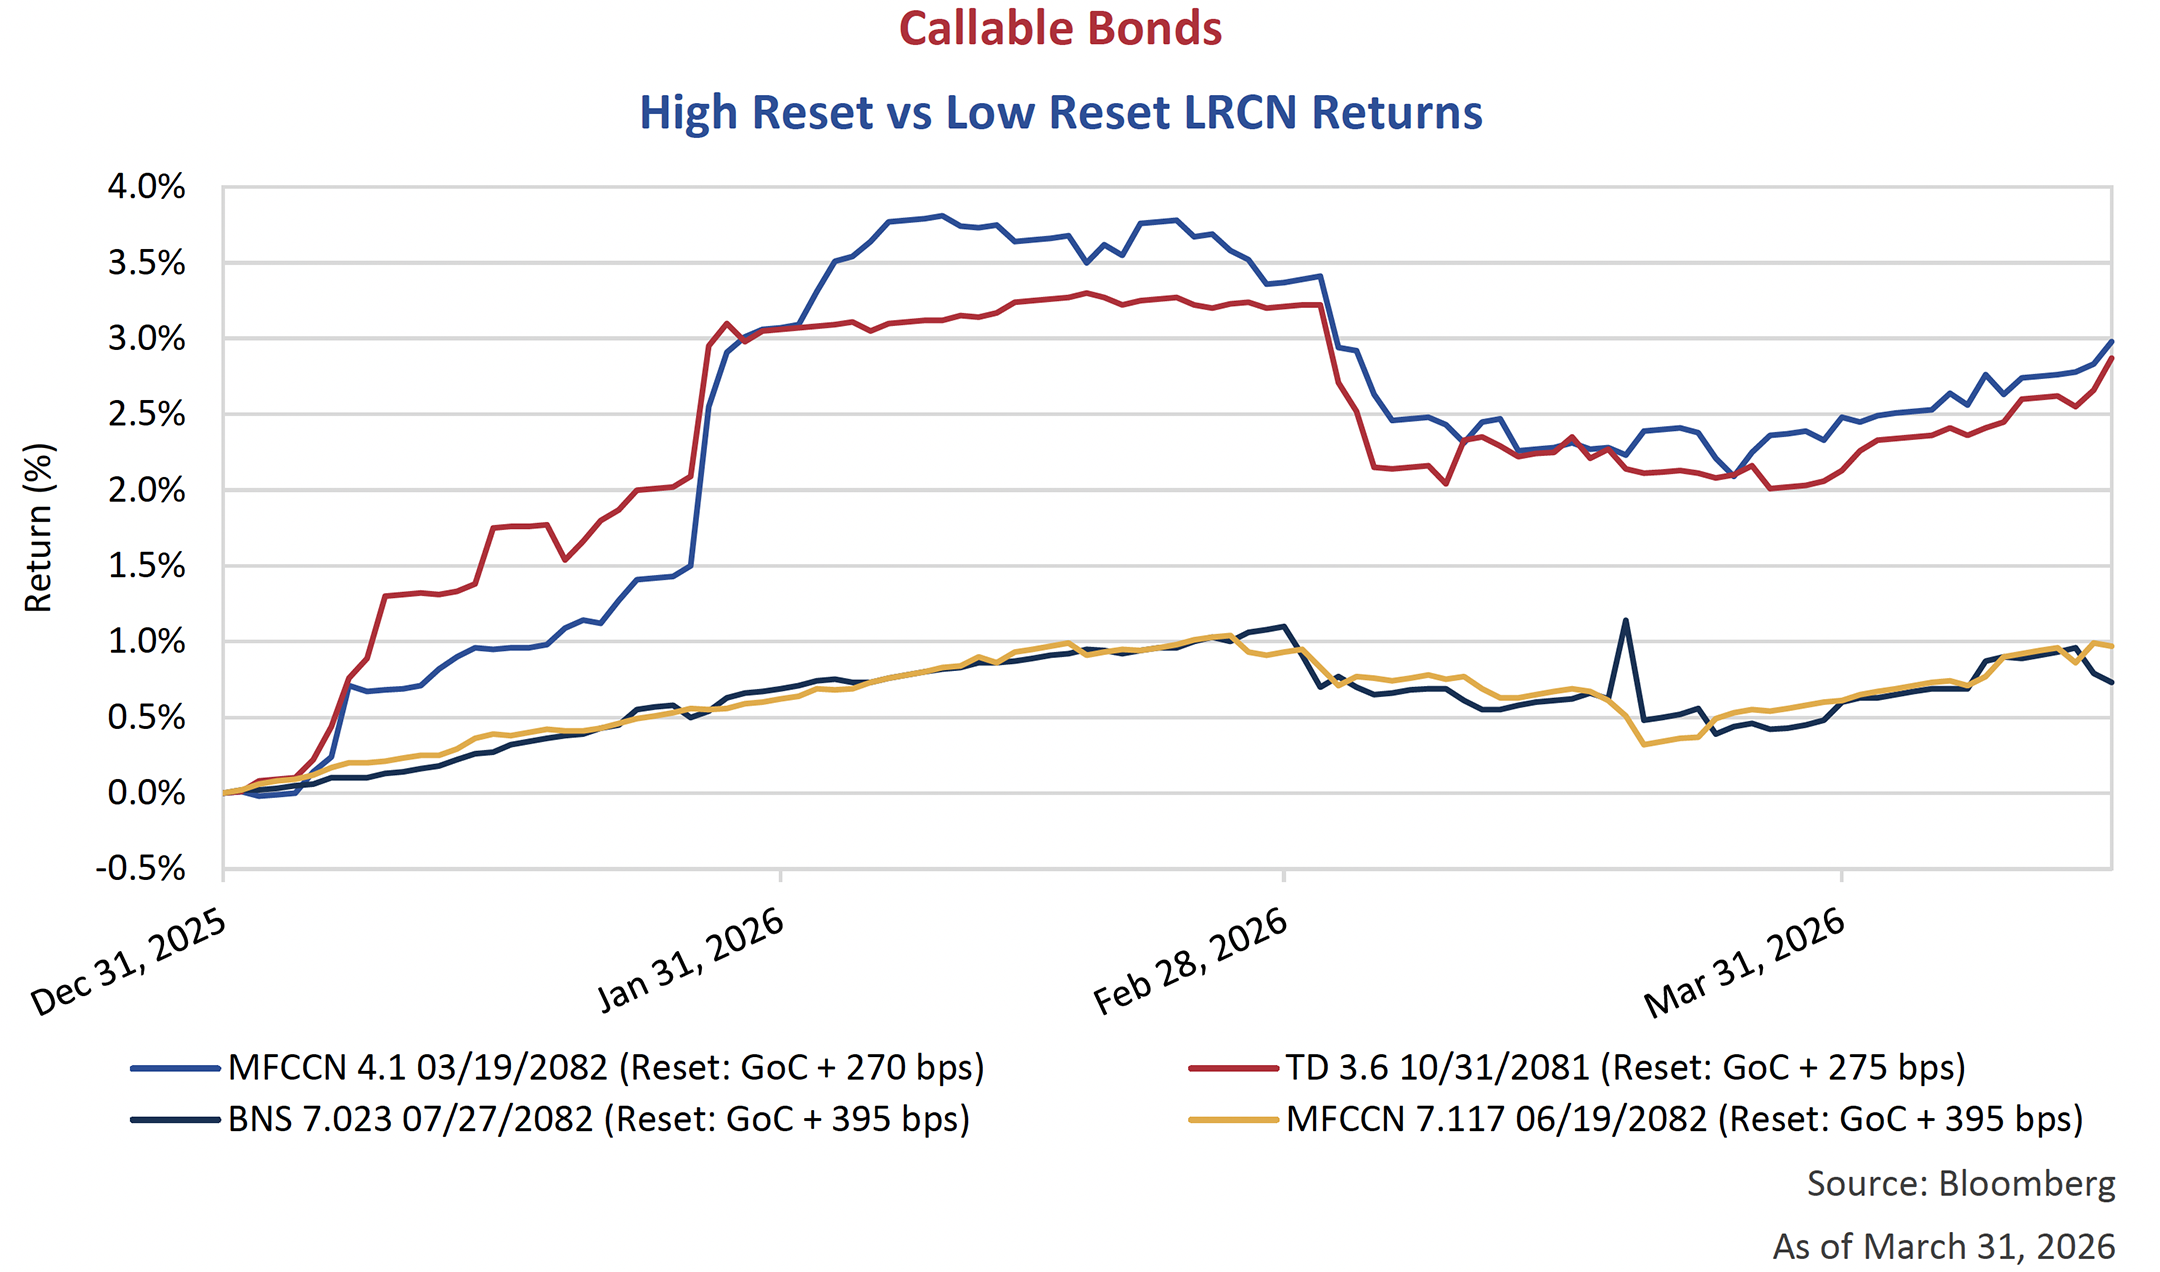
There is significant speculation for the remaining LRCNs with calls later this year as many have reset spreads below 300 bps. Call uncertainty leads these low reset issues to trade as part short-dated callable bond, and part longer-dated credit, creating greater price sensitivity and repricing potential. The price volatility of the low reset LRCNs is reflected in the running return chart below, comparing these securities to higher reset issues in the first quarter. Despite being more volatile, and carrying greater extension risk, they outperformed with returns of almost 3%, compared to less than 1% for their high reset equivalents. This is because extension is already at least partly priced in, while there is room for upside if calls do materialise and the securities accrete to par.
Ahead By A Century
As we shared in our January edition, 2025 was a record year for new issuance in the Canadian investment grade corporate bond market. Despite those lofty levels, new issuance in Canada has started this year 30% ahead of last year’s pace. In the U.S., investment grade issuance also hit a record of US$619 billion in the first quarter, led by historically significant deals from Amazon, Oracle and Google. These “hyperscalers” have announced hundreds of billions of dollars in capital spending to fund the AI revolution.
Alphabet Inc. came to the market in February with a US$32 billion deal across USD, GBP and CHF issues. This follows US$25 billion of fundraising completed in 2025. As recently as 2019, Alphabet Inc. had less than US$4 billion of corporate bonds included in the U.S. investment grade index. That number now stands at US$51 billion.
Of note in their recent deal, Alphabet issued a 100-year Sterling bond. A rare occurrence in fixed income markets, it is even more impressive that it is being done by a technology company in the age of AI. It seems to us that AI is progressing on a month-by-month basis. We would love to see what it looks like a century from now!
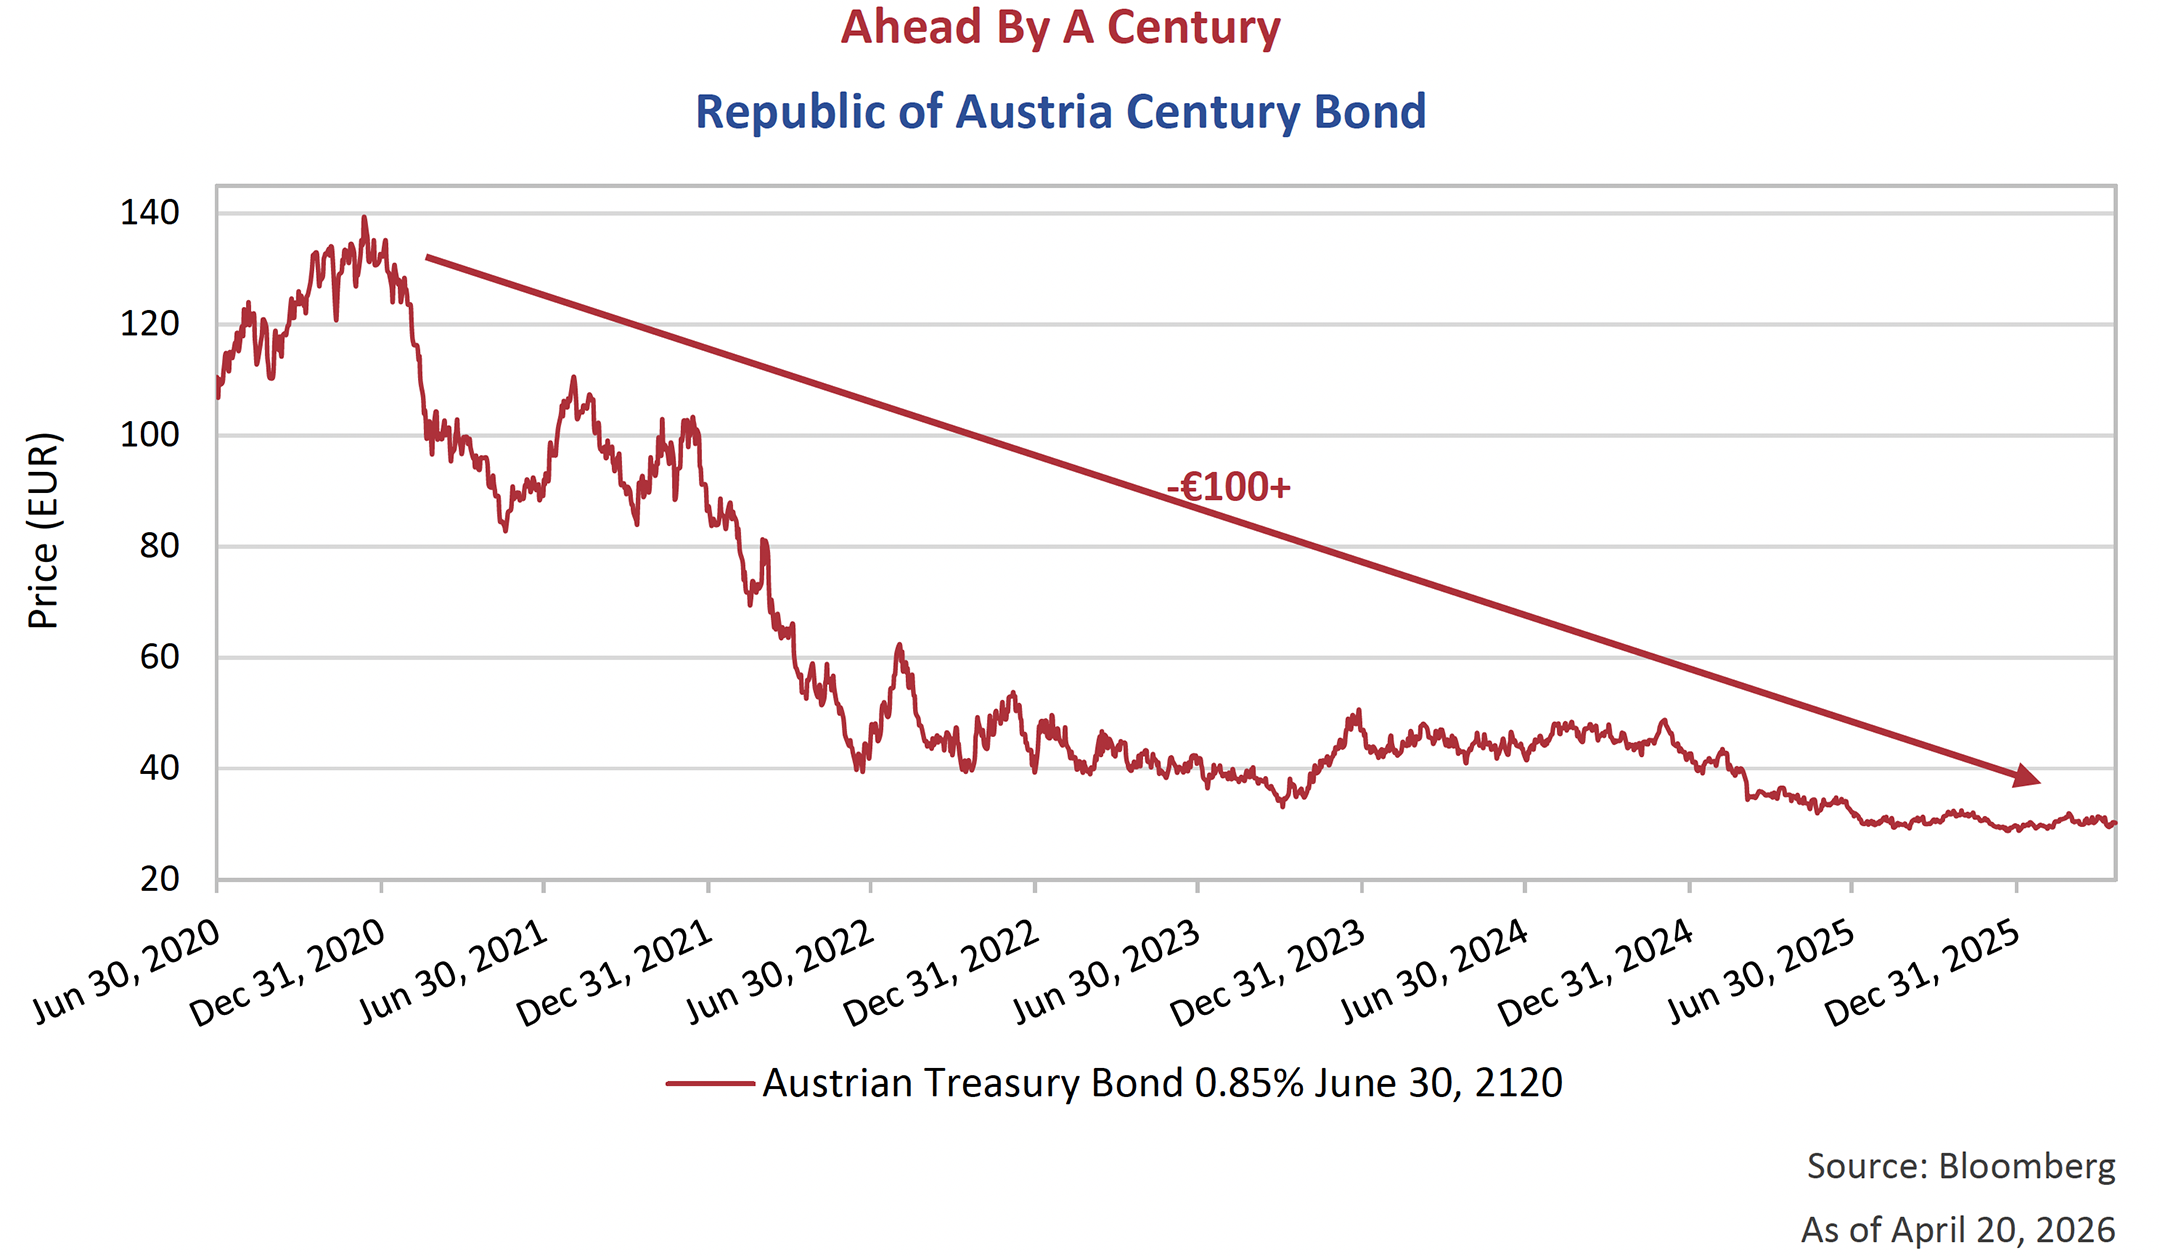
The Alphabet Inc. 100-year bond was issued at a credit spread of 120 bps above 50-year gilts and carries a coupon of 6.125%. To illustrate the duration risk, or price sensitivity, of a 100-year bond, below we look back at a century bond issued during the early days of Covid. In June 2020, AA+ rated Republic of Austria issued a 100-year sovereign bond with a coupon of 0.85%. The bond rose to €140 shortly after issuance but, with the rise in global interest rates beginning in 2022, now trades near €30, having fallen more than €100 in price.
Downshift
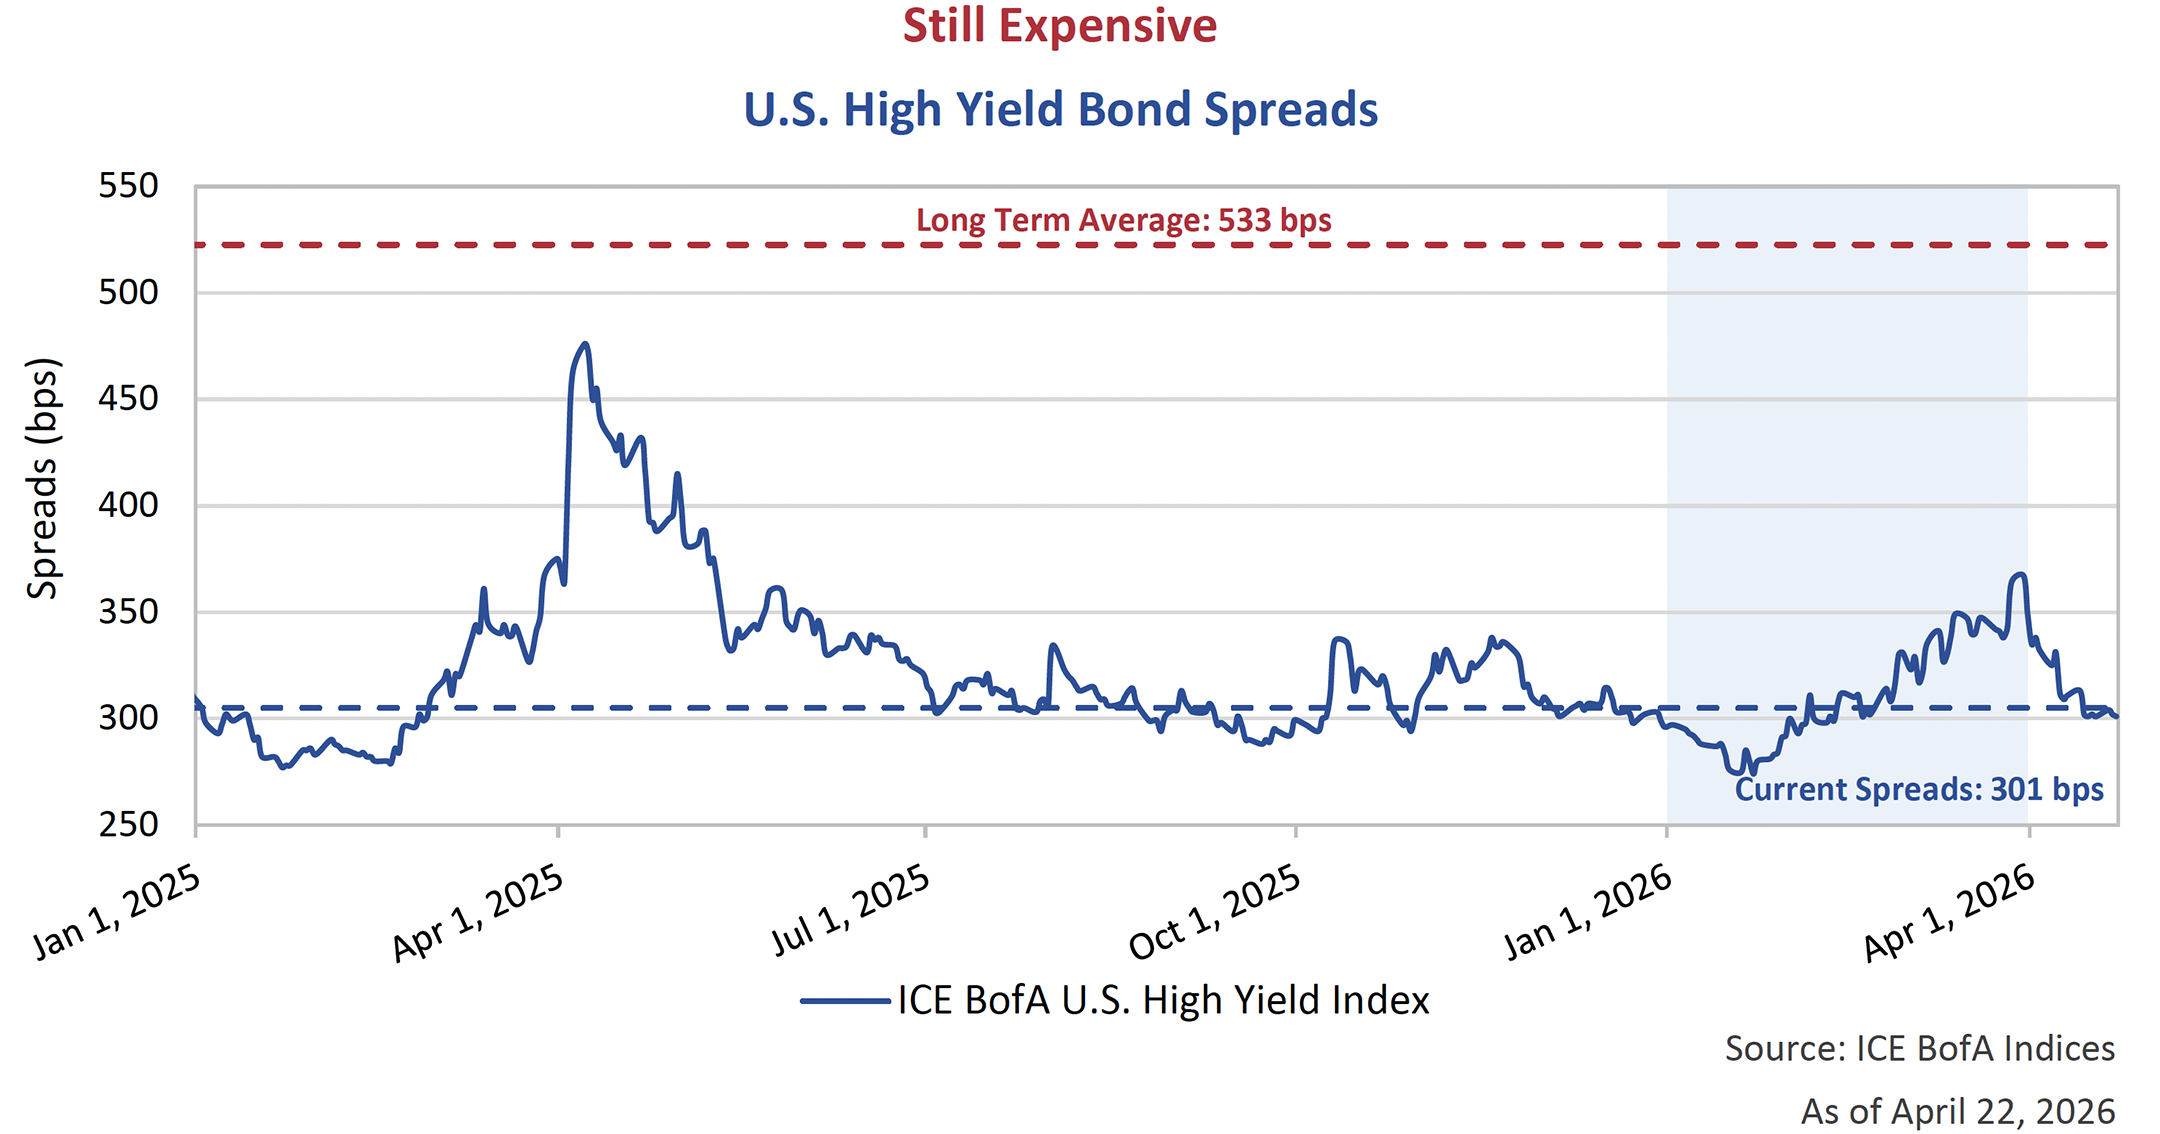
In the sub-investment grade bond market, high yield credit spreads have also remained contained throughout the geopolitical events of the past weeks. In fact, spreads came nowhere near the blowout of Liberation Day widening and are still well inside their long-term average. As we move through what has been a very strong April, spreads now sit back at 301 bps, close to where they started the year. With major equity markets now at all-time highs, the appetite for risk continues to endure, and this has carried over to the high yield bond market.
Margin of Safety Revisited
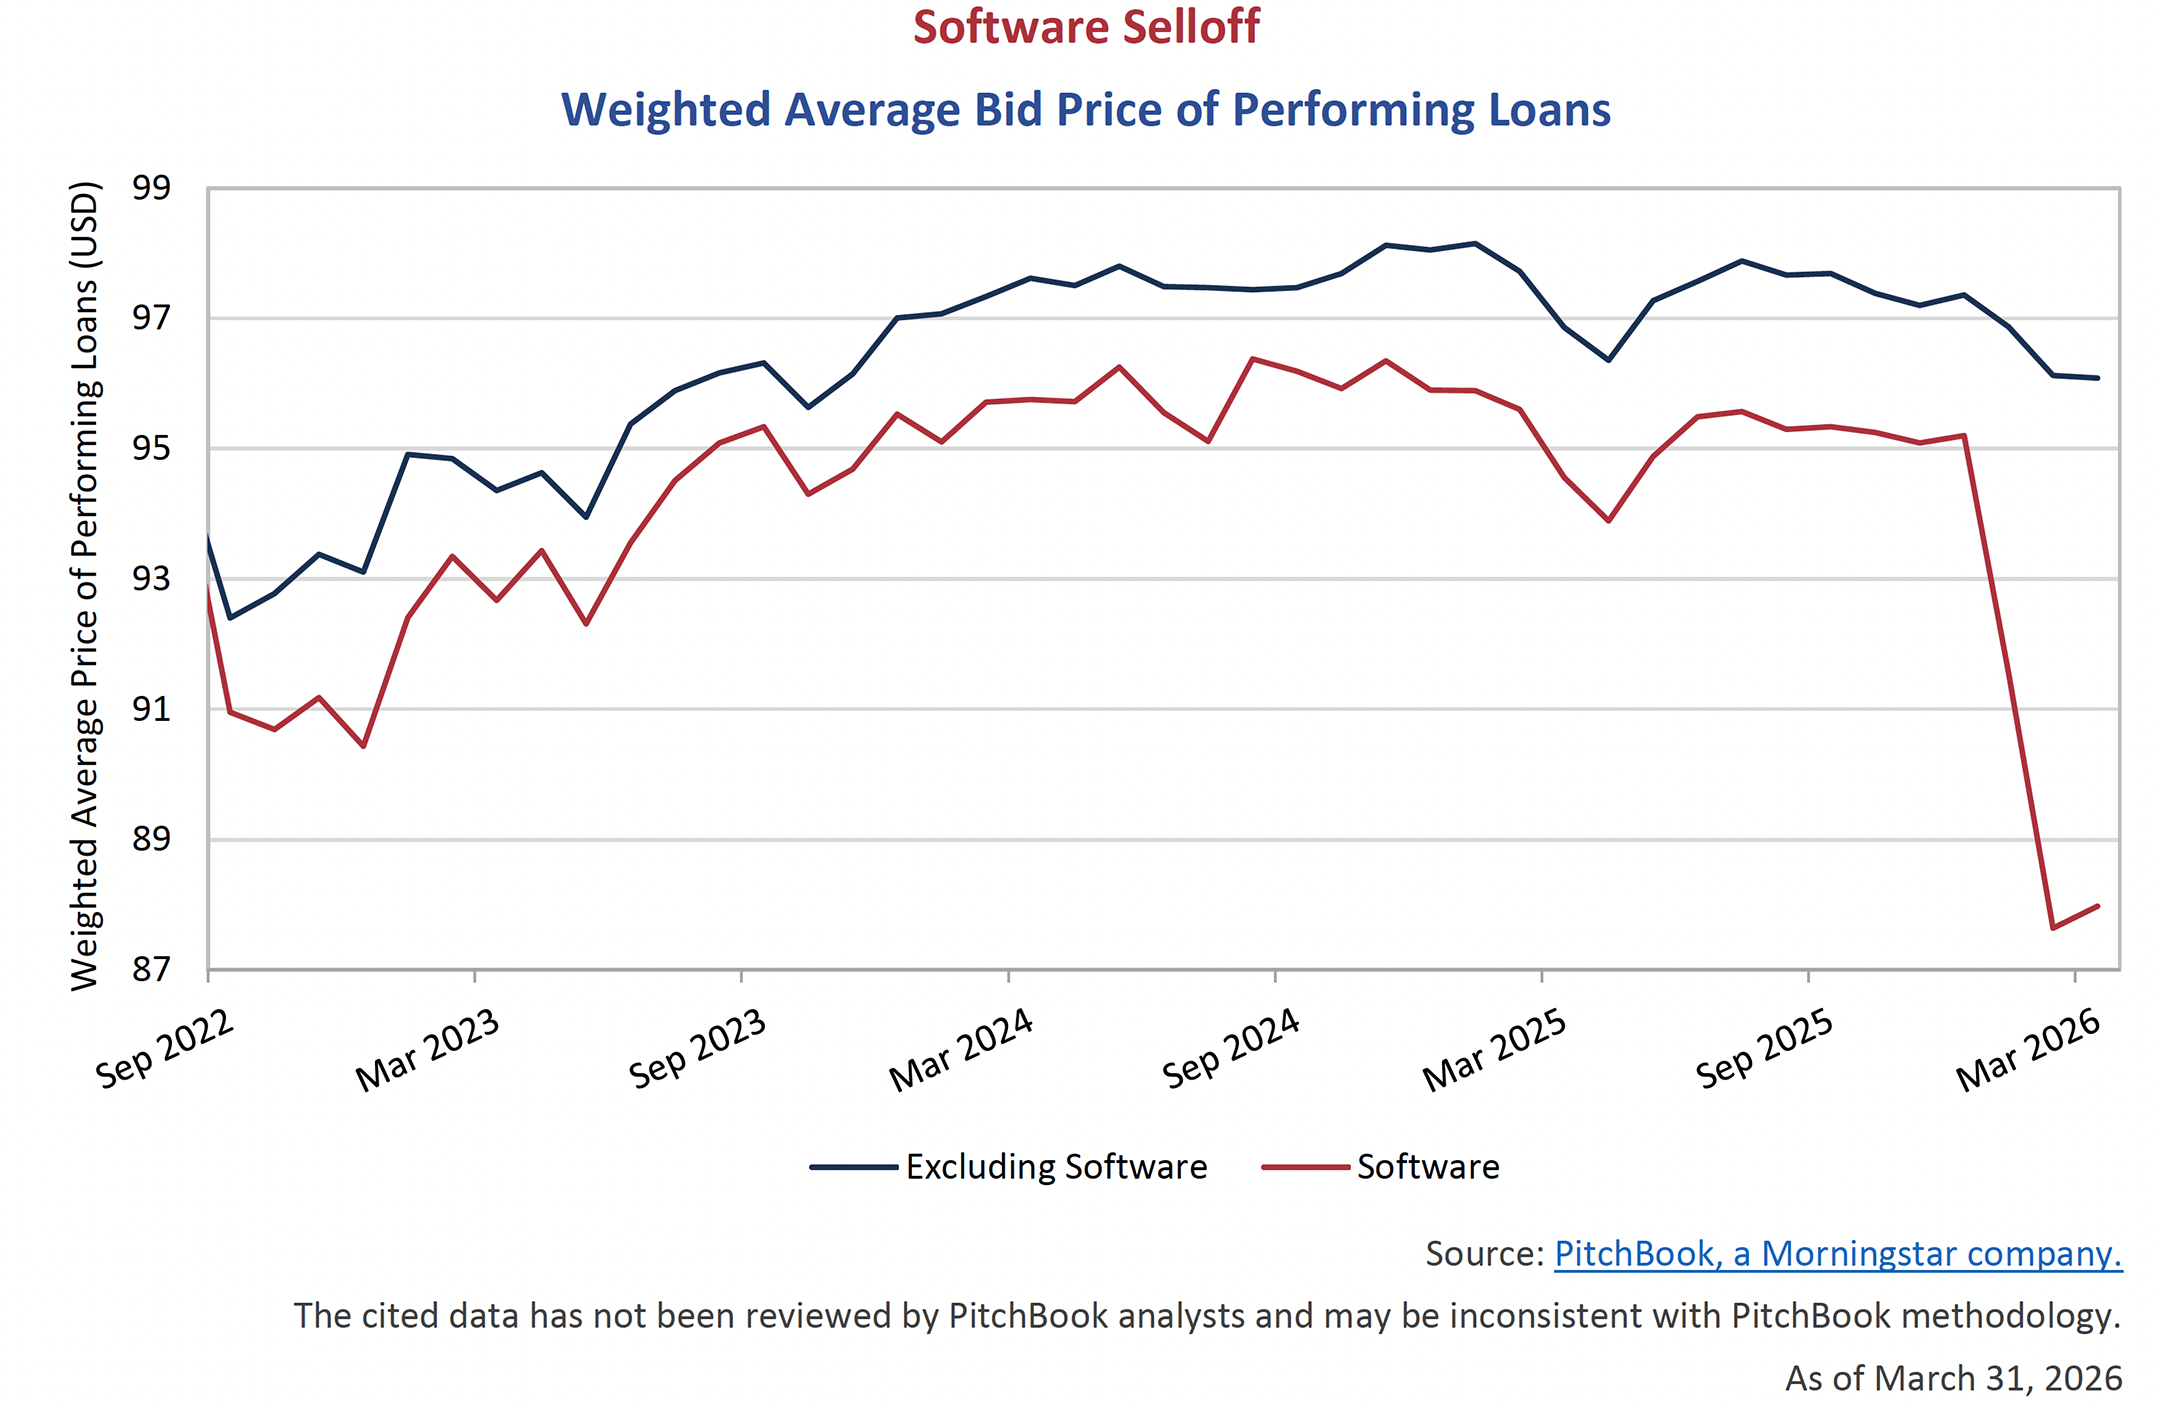
While credit markets have been surprisingly resilient, not all segments fared the same. Software makes up less than 5% of the high yield bond market, but over 10% of the broadly syndicated loan market. Concerns surrounding the impact of AI resulted in a selloff to software loans and equity in the period. These companies primarily fund within the broadly syndicated loan or private credit markets and have taken on increasing amounts of debt over the past decade, and for the most part, at historically favourable terms.
The pressure on software was not enough to thwart Electronic Arts from completing a US$18 billion debt financing at the end of March. This represented the largest Leveraged Buyout (LBO) debt-financing package since the Global Financial Crisis. The financing includes dollar and euro loans as well as secured and unsecured high yield bonds. The company was able to defy a down market and achieve oversubscription, as management made the case that the company has pivoted from one-time sales on game releases to a model focused on live in-game sales on their dominant franchises.
Credit Prose
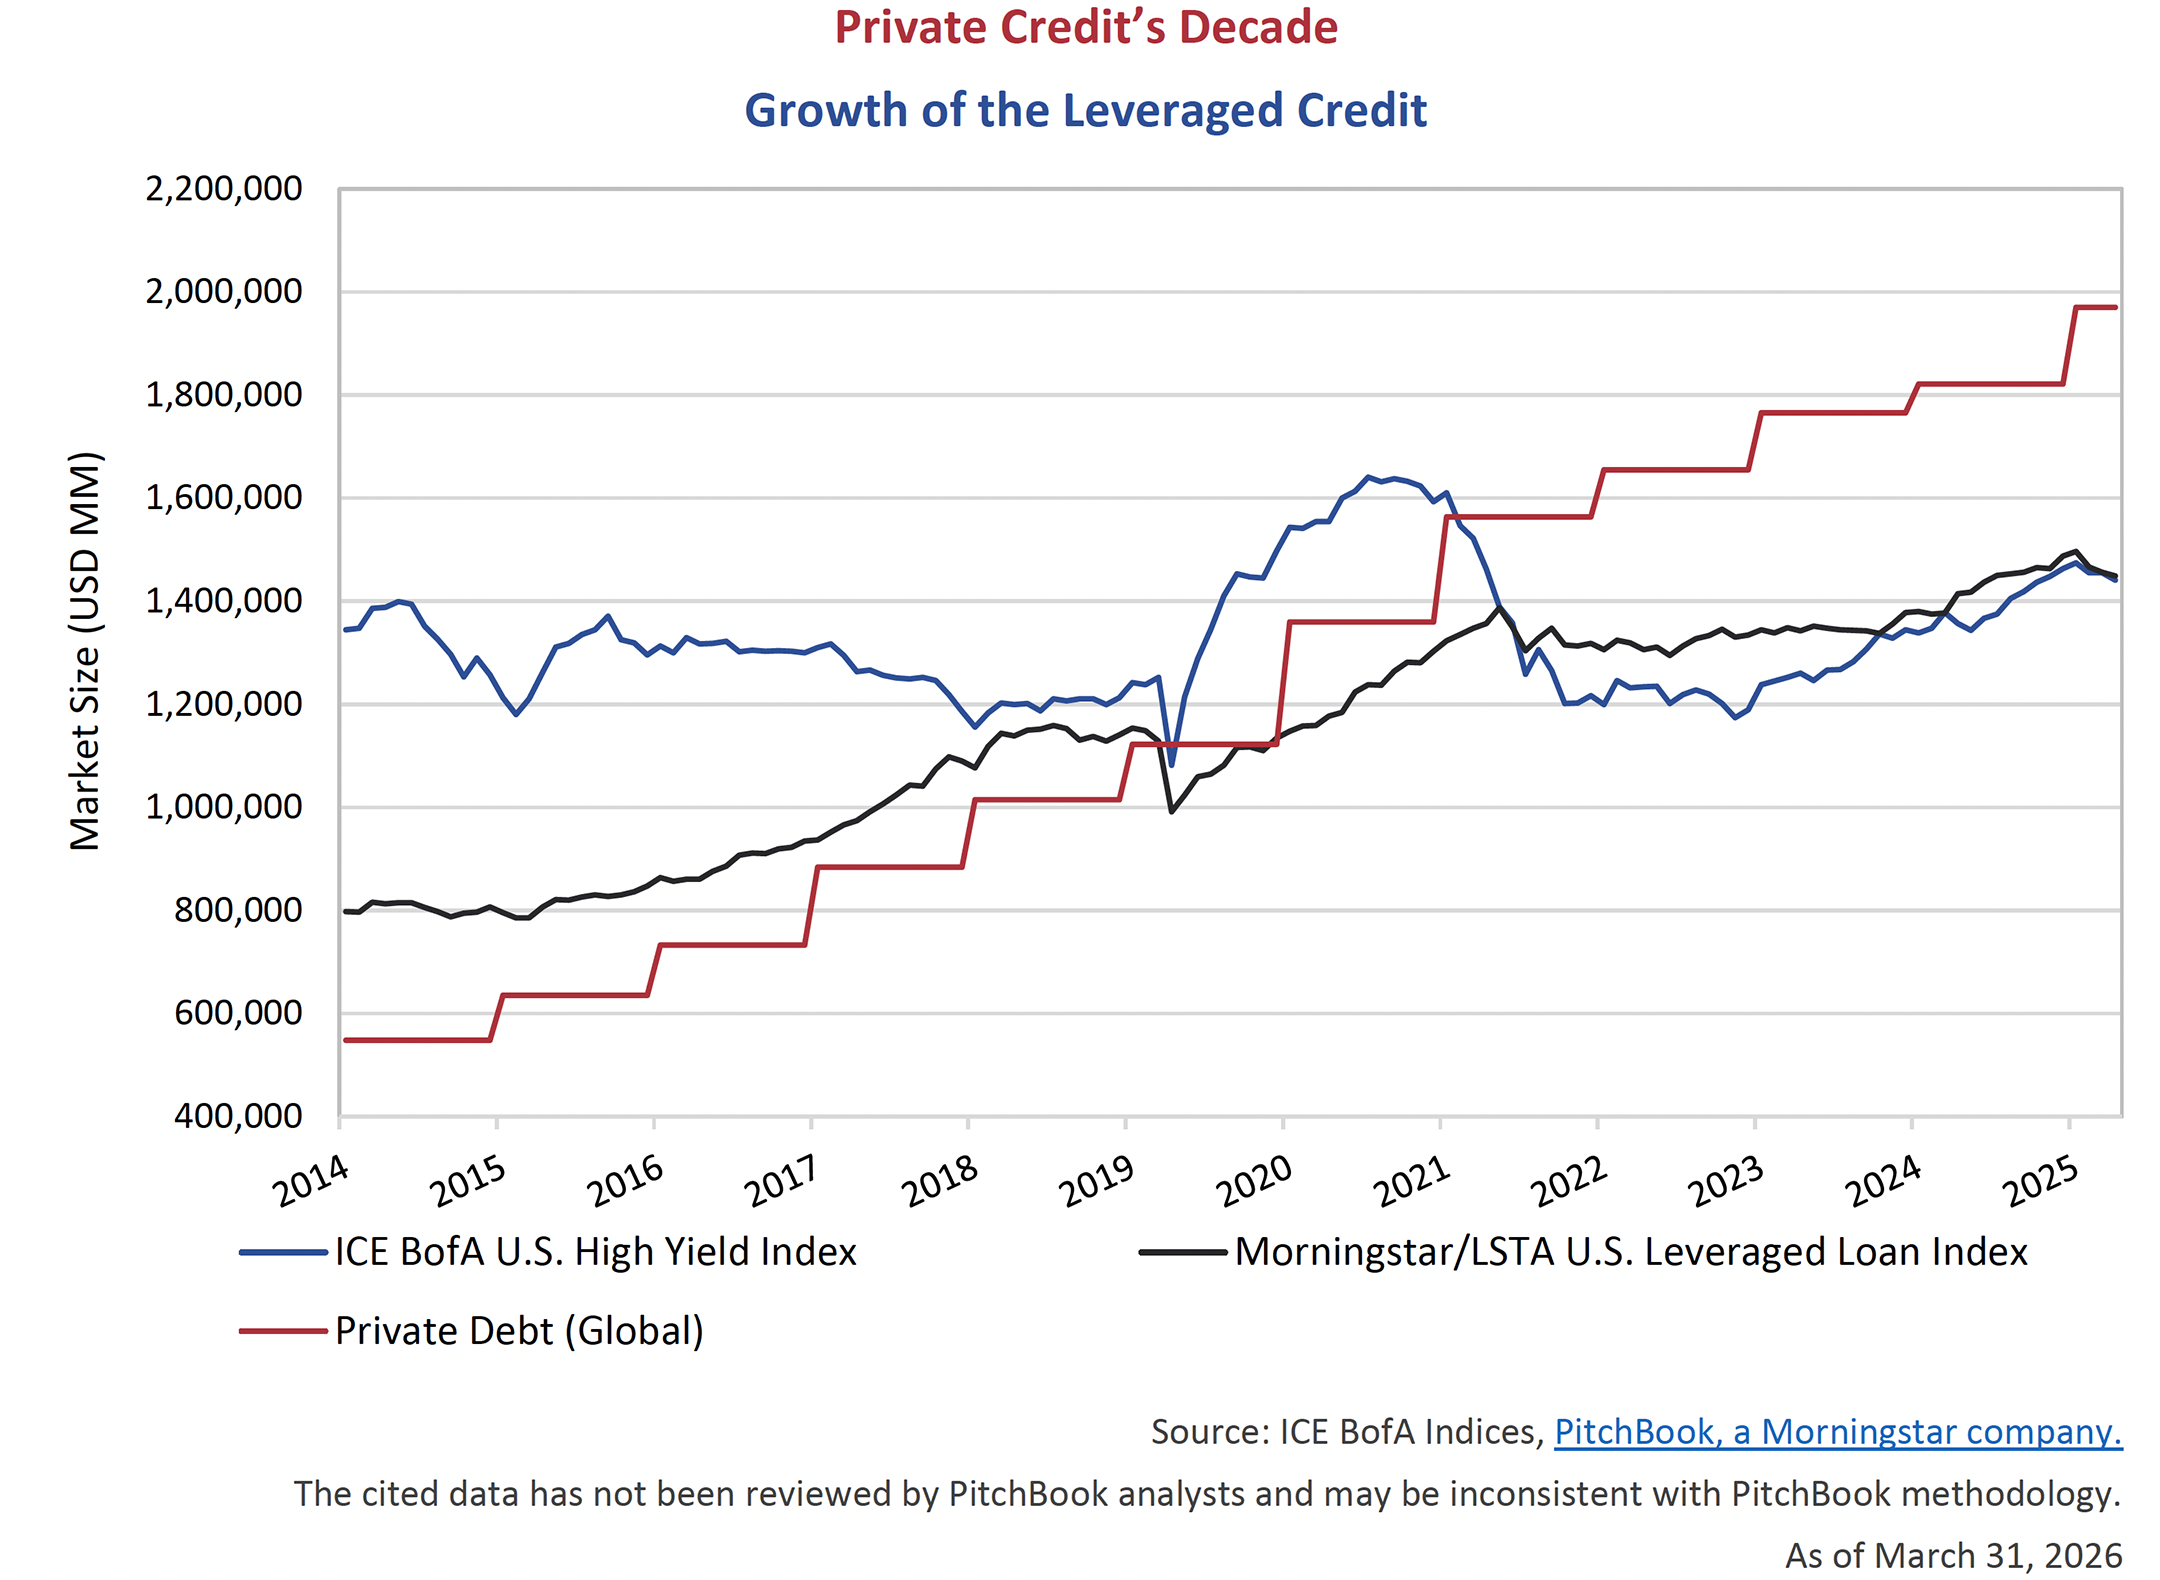
An increasing percentage of borrowing for sub-investment grade companies is occurring in the private market. We have once again plotted the size of the ICE BofA U.S. High Yield bond market, the Morningstar/LSTA U.S. Leveraged Loan market and the Global Private Debt market. Since 2014, Private Debt has seen significant growth, expanding over 3x, while the U.S. high yield bond market has remained relatively flat. As flows into private markets compete for deals, directly or indirectly, we would argue this has had an impact of holding in spreads on high yield bonds. Similarly, if flows in private credit begin to move in the opposite direction, we believe the impact will be felt broadly.
The draw to private credit has been in the allure of superior yields, especially during the “Zero Interest Rate Policy” era of the 2010’s. Higher yields could be achieved by investing with the “Credit Pro’s” who were able to source and structure deals that couldn’t be found in the public markets. The issue became that higher returns attracted increased flows, increased flows competed for larger and fewer deals, and competition for deals leads to lower coupons or weaker structures. Instead of borrowers seeking out lenders, lenders were seeking out borrowers.
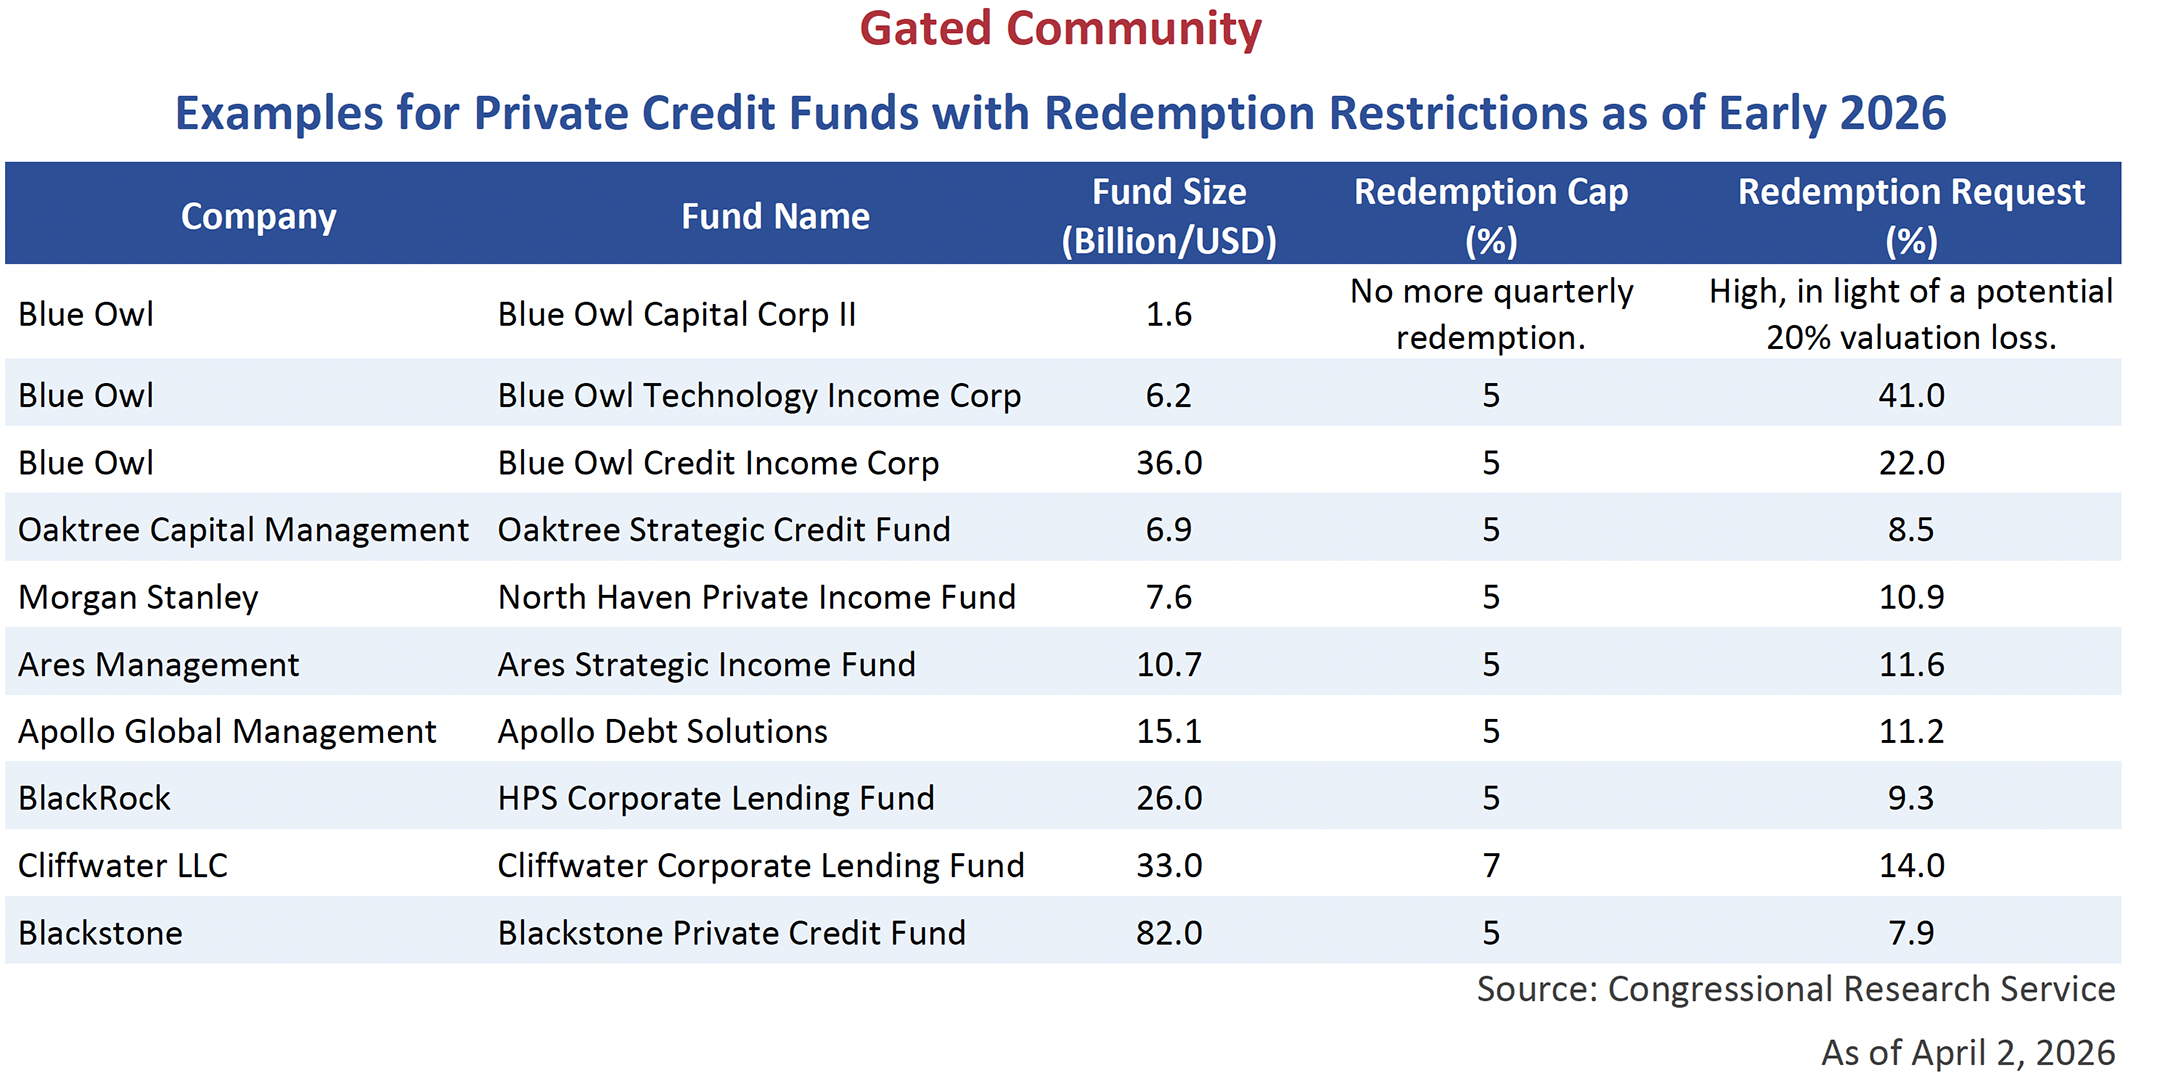
In the investment markets, as in life, there is no such thing as a free lunch. Higher yields are often achieved by taking on more credit risk, loosening covenants, increasing complexity, adding leverage or giving up liquidity. In private credit, the advantage is typically giving up short-term liquidity to achieve greater long-term returns. Illiquidity is a feature, not a bug. Investors are now questioning what it really means to give up liquidity. Redemption requests have increased as investors have become wary of credit risk and valuations, so much so that funds have been required to restrict redemptions, typically at 5% of invested capital per quarter. This has caught the attention of the U.S. Government, who produced the below table in a recent Congressional Research Service (CRS) Insight.
Limited Upside, Unlimited Downside
As fixed income investors, a reality of our market is that we have limited upside but the potential of losing our full investment. Our upside is receiving our principal back at maturity and our coupon along the way. Our downside is receiving zero. In a bankruptcy or restructuring, bondholders are afforded first claims on the value of the business, but there is no guarantee you will recuperate your full investment. If you are in a poorly structured deal, where you have no security, other lenders rank ahead of you, or the company can move assets away from your domain, the downside can be severe.
Confronted with this reality, credit investors need to be compensated in the form of credit spreads. We are happy to take on risk when we are compensated to do so. What’s more difficult is being disciplined and not taking on risk when the prospective returns are not commensurate. We don’t know exactly where the next credit opportunities will present themselves, whether that be from illiquid privates looking for a bid, AI impacted industries whose business models need to be reassessed, or some other parts of the market entirely, but we are ready to take advantage of those opportunities when they do. In the meantime, outside of our special situations, we prefer the relative value in high-quality and highly liquid positions.